BTCUSDT
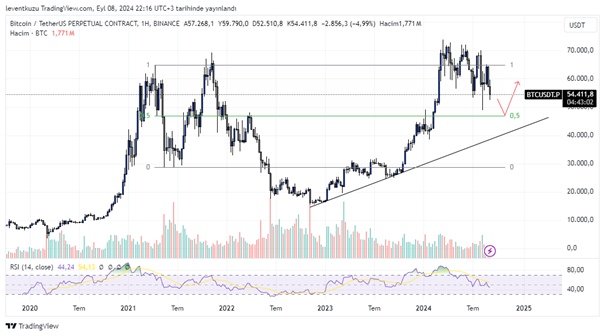
1W analysis
The high time frame analysis shows critical point for BTC. A range is available from the last bullish season. The range has well reacted equilibrium and deviations on buy-side and sell-side. The candles are forming lower lows and lower highs. This resembles a bullish flag. The nearest strong support is the equilibrium of the range, which is around $47k. On the other hand, there is an increasing trend from the start of the recent bullish BTC movement. If price loses the equilibrium, the trend line hand hold the price around $40k. But this is an extreme point. Weekly RSI is important especially on the crypto market. Now it is below the mid-level. If below targets are achieved, then RSI would also be close to over-sold region. These regions are good places for taking long positions.
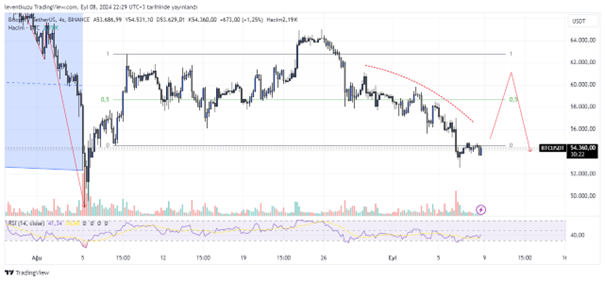
4H analysis
There are significant open liquidities on 4H chart of BTC. These are critical attraction points. BTC deviated the range on the buy-side. However, a drop was not realized. The price is increasing and RSI is gaining momentum. Therefore, I expect the price to gain the range again. In this case, a price increase will be possible at least until equilibrium of the range. A second target can be $61.2k, where liquidity is available. But this will not be an exact bullish movement. According to HTF analysis, there is some more possibility for a continuation of the drop.
XAUUSD
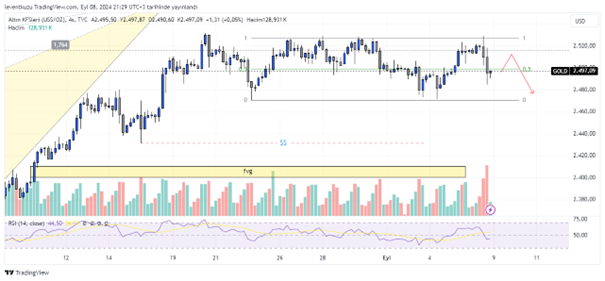
4H analysis
Price of gold is struggling to move out of a price range. All price change occurs only between 2-3% for 20 days. The price expectation was satisfied with the range drawn last week. But we have enlarged price candles. So it is best to revise the range structure. Deviations occurred several times from range high level. But range low of the current figure has never been realized. That’s why I expect a deviation from range low level. According to the movement, we will decide whether it will be a deviation or break of the range. If it is a break, then the target will be the liquidity and FVG below.
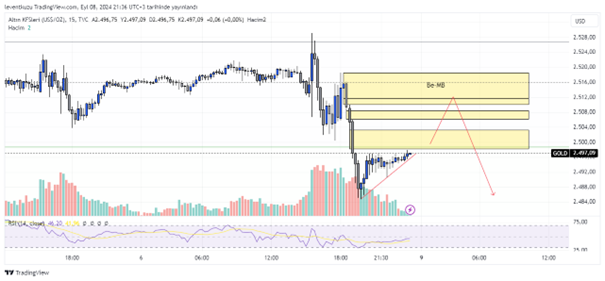
15 min analysis
The market structure of 15 minute chart is bearish. The last swing low was broken by significant candles including imbalance. This has generated a bearish mitigation block. Under that block, there three different fair value gap zones. The price is likely to return from either of these rectangles. The extreme point can be taken as Be-MB. The price of gold generated an ascending triangle recently. This is a bullish pattern. This confirms the expectation of price increase, then a decrease towards the lowest candle wick available on the chart.
EURUSD
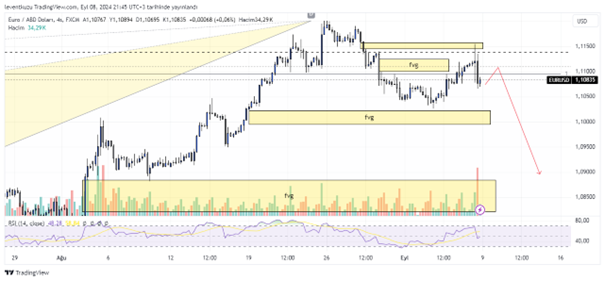
4H analysis
As the bearish harmonic pattern has been active two weeks ago, we are still waiting for a price drop. The most significant imbalance below is the attraction point and just above the equilibrium of a range. Two buy-side FVGs were removed last week. Now, we only have FVGs on the sell-side. There is not a point of interest any more above. The decrease of the price without an upward movement is most likely to happen.
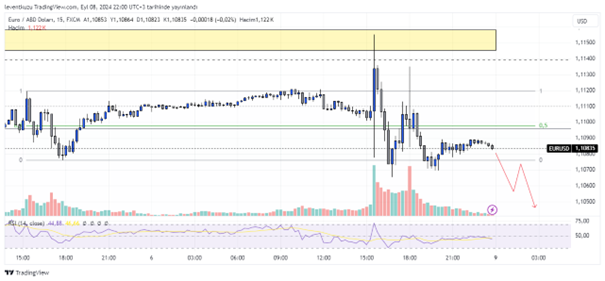
15 min analysis
Current price range was deviated on both sell-side and buy-side. The buy-side deviation reversed from fib 1.618-2 gap. There were minor deviations on the sell-side. The state of the price is towards to a drop. After the break of range-low level, a retracement should be observed. Once confirmation of RL as a resistance occurs, price will keep its downward movement.
** Important Note: Above ideas are not investment advice!**