BTCUSDT
4H analysis
Chart of last week was according to our expectations, which removed the arc of liquidities towards $60k. We can now observe an inverse head and shoulder pattern. The level of the shoulders match well, shown by the pale blue colour. The neckline was broken through a strong candle. Its target will be the above liquidities, which is over $64k. Before moving towards this target, a retracement of the price is possible.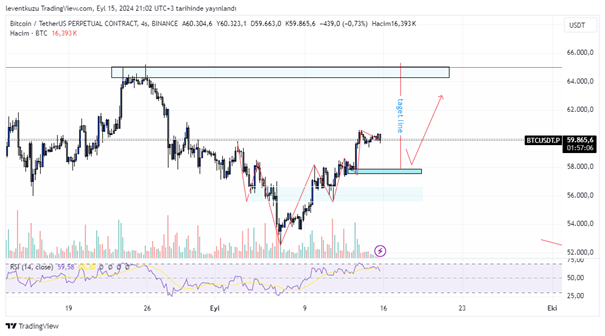
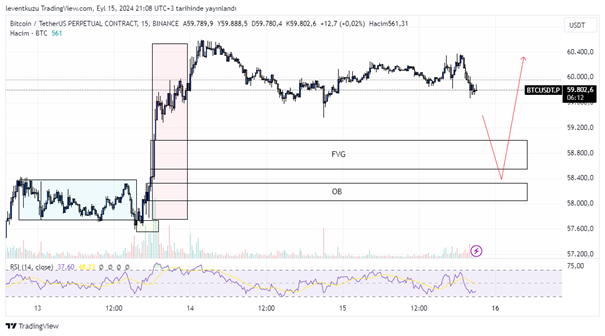
15 min analysis
On 15 minute chart, a PO3 type price movement was available. The first box shows the accumulation of the price, it manipulated the sell-side and price moved towards buy-side. The price can reach to lower levels, shown by FVG and OB. These two regions are important interest locations for the price. After that, we can expect HTF targets.
XAUUSD
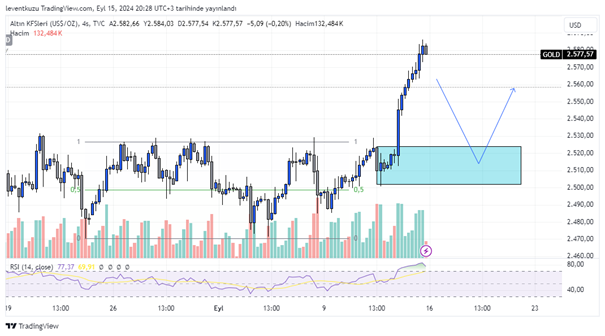
4H analysis
The price movement of gold has been towards the sell-side of the range structure. The range was broken with a strong expansion. Now we have to wait for a retracement to the order block which started the price movement. This price movement until the order block will also fill the fair value gap, occurred through the impulsive movement. $2520 seems the initial target for the price.
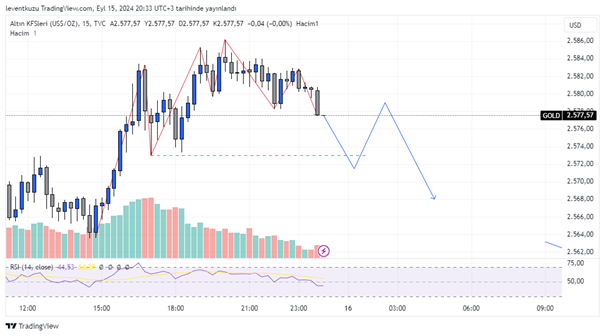
15 min analysis
The 15 minute chart is struggling to keep the price at top while it is losing momentum. There is a market structure shift on lower time frame. But to be on the safe side a candle close below $2574 would be more reliable for a possible reversal. Once reversal is confirmed, then continuation of a bearish movement will be available on the chart. If this is the case, we should look for a point of interest at the retracement leg.
EURUSD
4H analysis
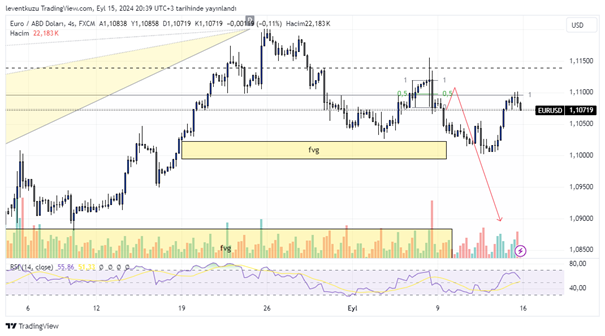
EURUSD chart is still in play with the structure available from the last week. The movements are according to the expectations, that’s why I did not remove last red path. There is still some more dips to be reached below 1.09 pair price. The line shown with “1” is the upper level of a HTF range. It was first manipulated, then came into the range and reacted downwards from that level. During these price movements, most of the first FVG was filled. Now, the price has to reach to the second FVG.
15 min analysis
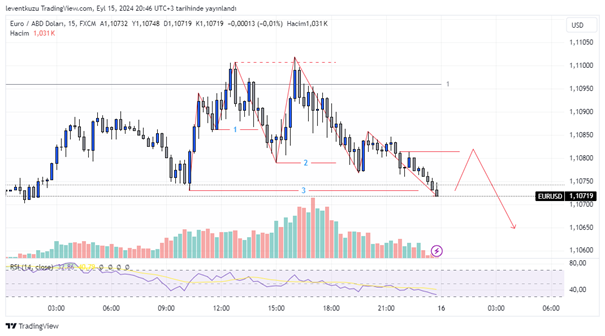
Market structure of 15 min chart turned to bearish. There are multiple LTF breaks shown with the numbers from “1” to “3” with the horizontal red line. On the other hand, a swing failure pattern was formed by taking the liquidity at the top. This was another sign for a change to bearish movement. RSI has reached nearly to the over-sold region. Some price increase until the double top wicks can be seen until the red horizontal line on the right. After that, price can continue its bearish movement.
** Important Note: Above ideas are not investment advice!**