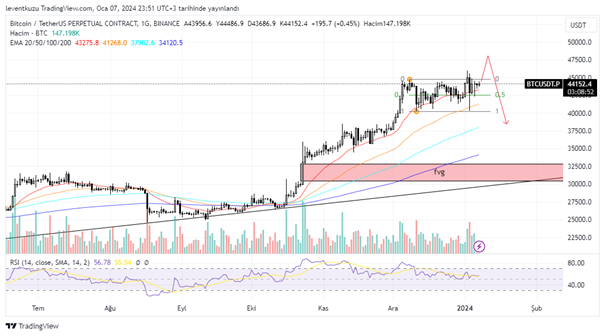
BTCUSDT
1D analysis
There was a range starting from the beginning of December 2023. In the last week’s bulletin, we expected a range manipulation above and then a strong downward movement if the range high does not hold the price. This scenario worked quite well. Now the price is still above EMA20. If we check RSI, the momentum is losing its efficiency. This week is quite important in terms of ETF approvals. Once approval news is issued, then we may expect a severe pump on BTC price. After that a possible “sell the news” can happen. If it happens, profit realization can drive the price down to $35,000s in the first instance.
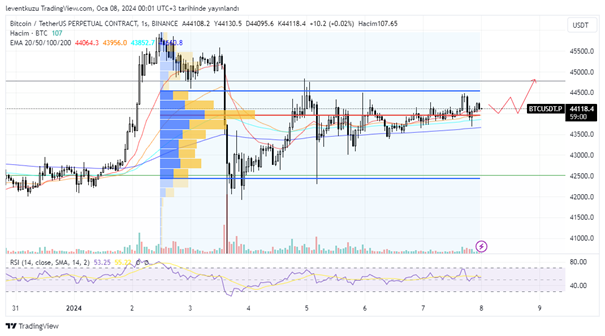
1H analysis
The fixed range volume profile shows how important the current price is. The range was prepared from the last swing high price until the current price. Price is just above the point of control, where is the line, the highest trade occurred. Value high can be broken upwards by the increase of volume and then we may expect higher prices.
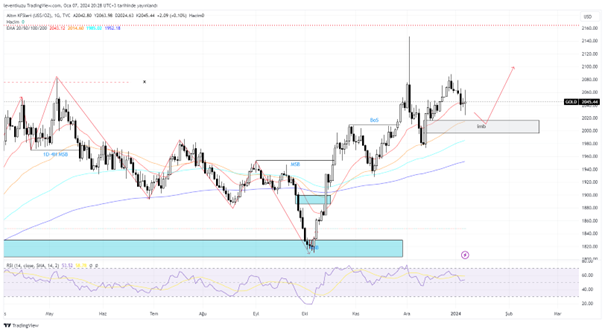
XAUUSD
1D analysis
The market is in an uptrend since October 2023 on the daily chart. The price is within the retracement leg of the last upward move. $2,000-2,015 seems to be a reasonable reversal area since there is a fair value gap and a possible EMA100 cross at the lower boundary of the zone and EMA50 cross at the upper boundary of the zone.
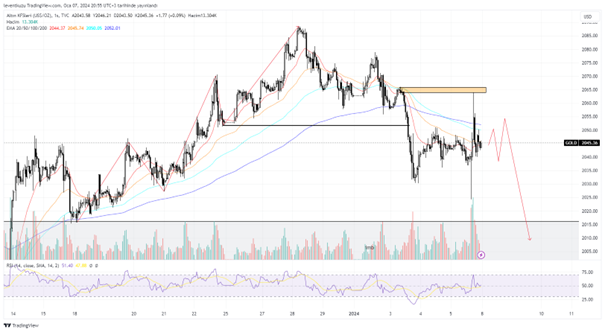
1H analysis
Market structure shifted to bearish on 1 H chart. On lower time frames there were possible earlier signs of reversal but taking into consideration of 1H chart, the price drop with huge momentum, which resulted a MSB, created a bearish order block. The price well reacted from the order block. We can still expect lower prices until reaching the imbalance zone below around $1,995-2,015. This area is also the potential reversal zone that we analyzed on 1D chart.
EURUSD
1D analysis
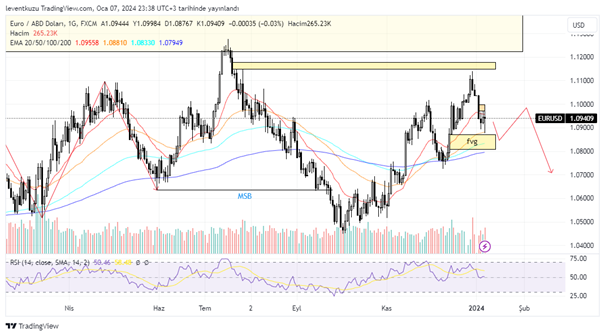
Market structure was shifted to bearish on October 2023. The price reached the premium zone. There is still a fair value gap that the price could reach, however, it was not easy for the price to reach that level. In the closest view, there is another fair value gap that can be filled below the pair price. The upper boundary of the box corresponds to EMA50, the lower boundary of the box corresponds to EMA200. These are possible reversal price areas. After the reversal, price can keep going downwards to make a break of structure, below 1.045s.
1H analysis
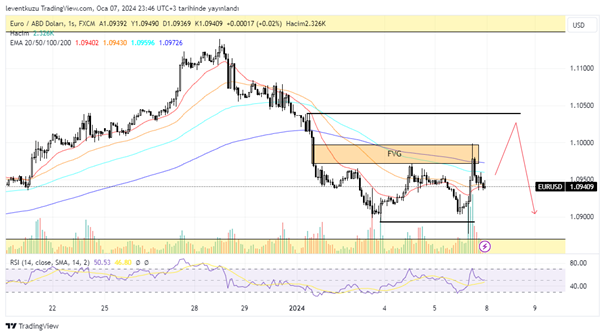
The liquidity below was swept by the price and this created a momentum, which could close the fair value gap above. After that price reached the equilibrium of the last short term range. Now we can expect again to attack another liquidity above, then expect some more price drop.
** Important Note: Above ideas are not investment advice!**