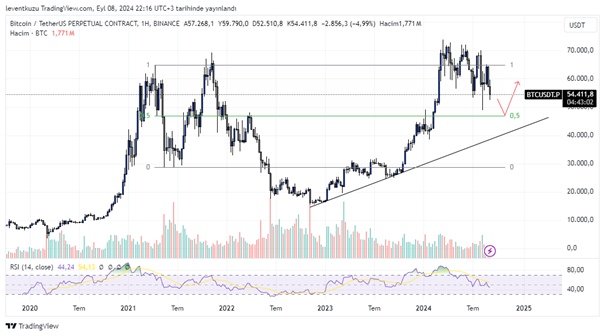
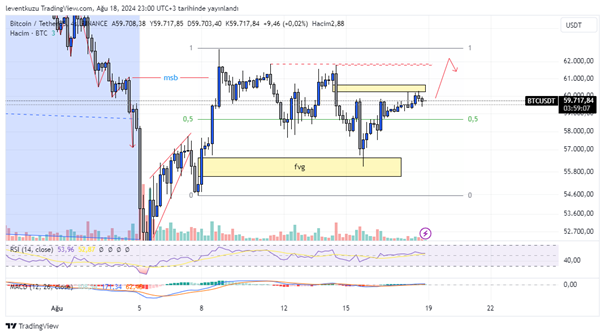
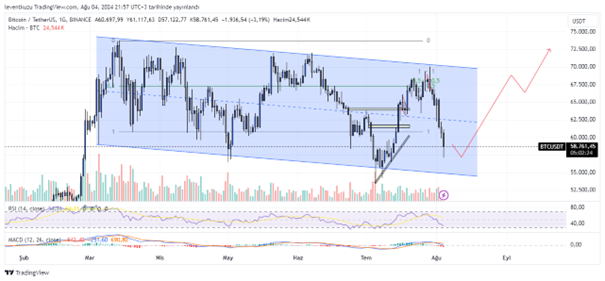
BTCUSDT
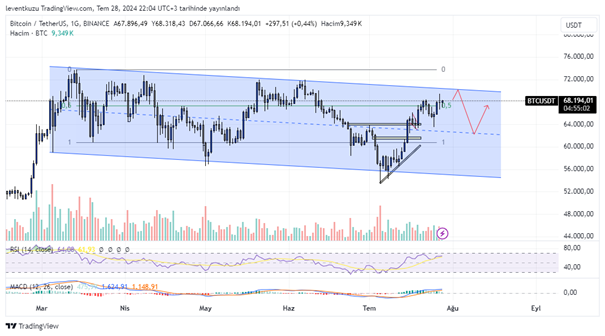
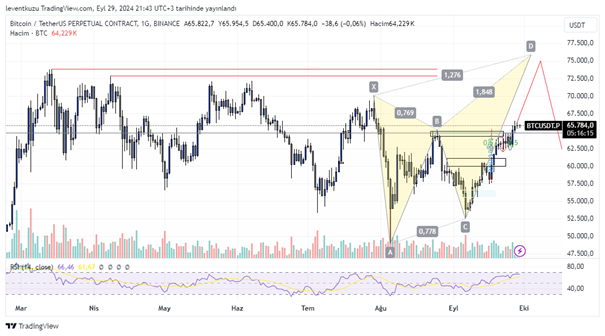
1D analysis
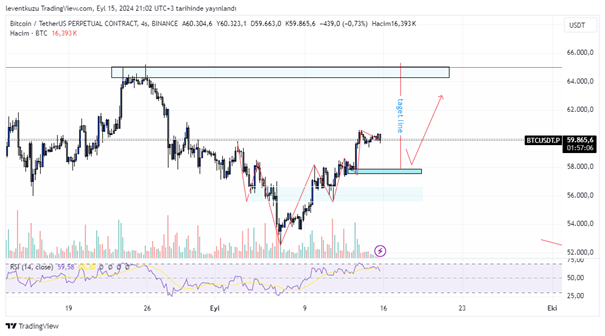
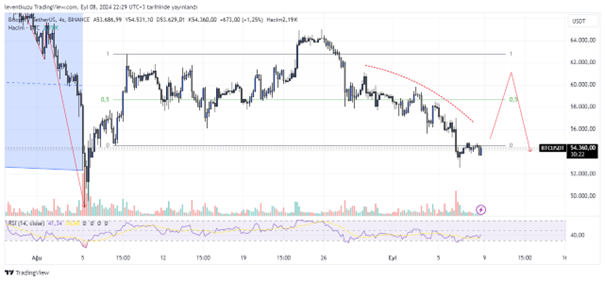
A possibility is shown on the chart for a daily viewpoint. There is yet an incomplete butterfly like formation on the chart. But B point of the harmonic pattern could not reach fib 0.786 of X point. It is just a bit low from the price. If we accept this as a butterfly pattern, the above liquidities can be swept and a reversal to $60k will be possible.
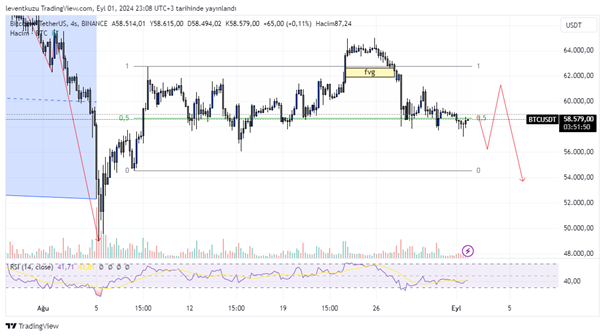
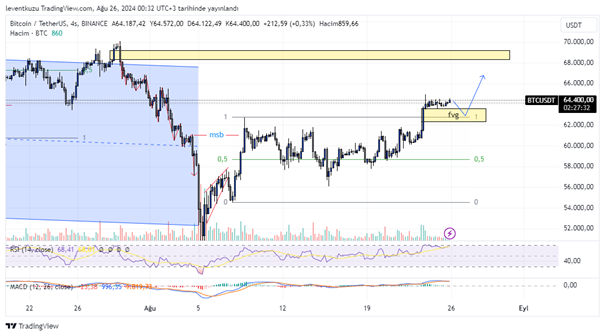
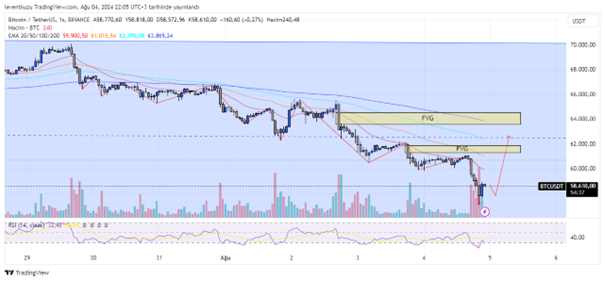
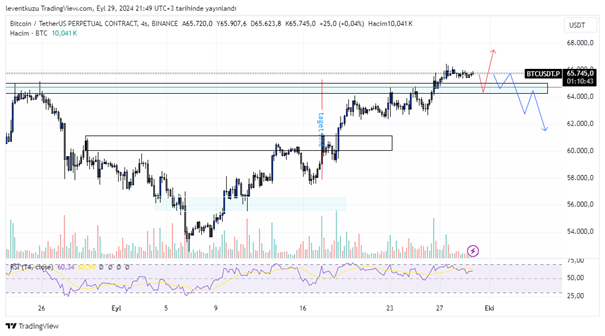
4H analysis
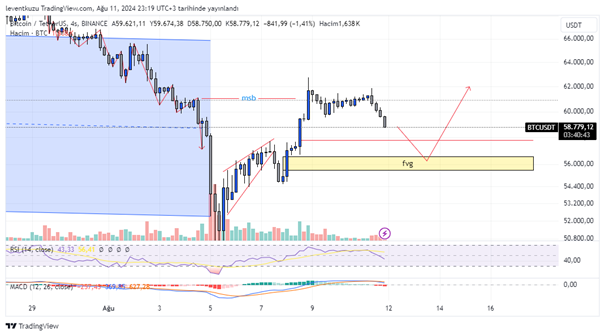
The expectation for the last week has reached its target. Head and shoulder formation is completed after the break of the neckline. The S/R zone drawn by blue box was tried to be broken twice and on the third attempt, price went over the zone. Now, there is an accumulation over the area on a LTF chart. Price can stay over the zone after a retest and price can go higher. This is the primary expectation, shown by red colour. If the price is unable to hold over the S/R zone, it will move downside of the box and after a retest price can go lower. But the most likely expectation is on the bullish side.
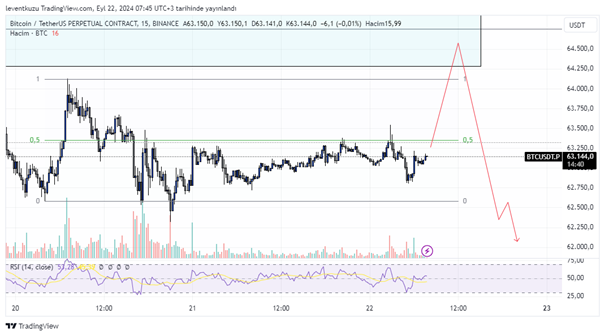
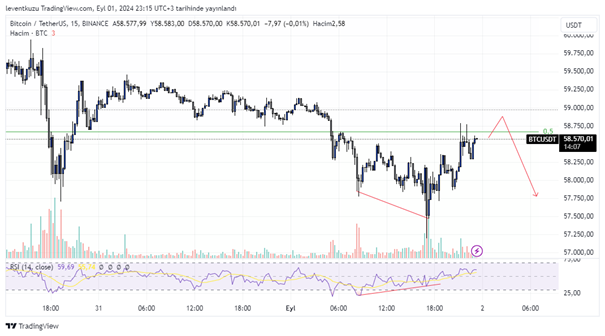
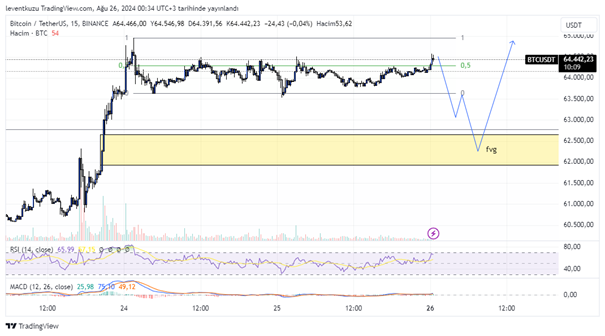
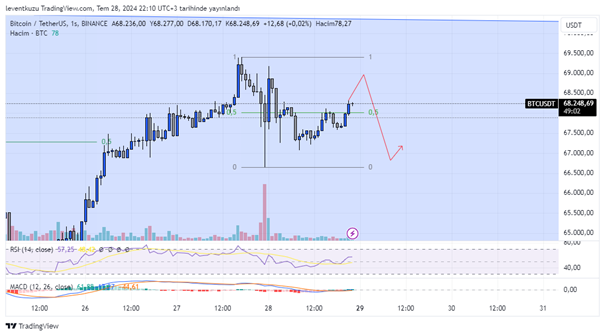
15 min analysis
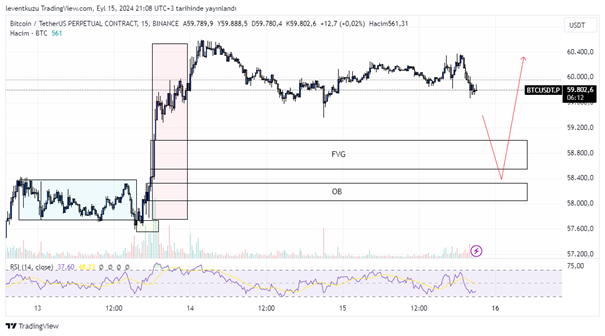
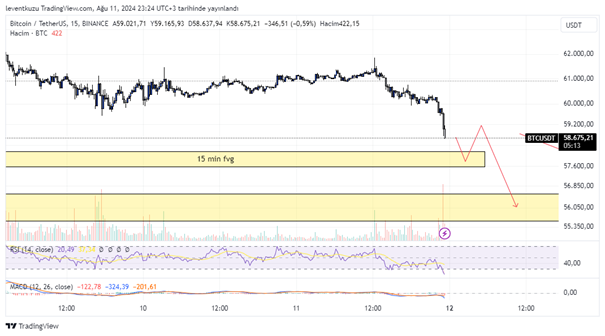
The price is within a range on 15 minute chart. A deviation occurred though sell-side boundary of the range. A buy-side deviation is probable. Once this happens, the resistance area will be visited. This area will be a possible barrier and price will want to move towards first range-mid and then range-low levels. The loss of range and retracement will show us the possible price directions.

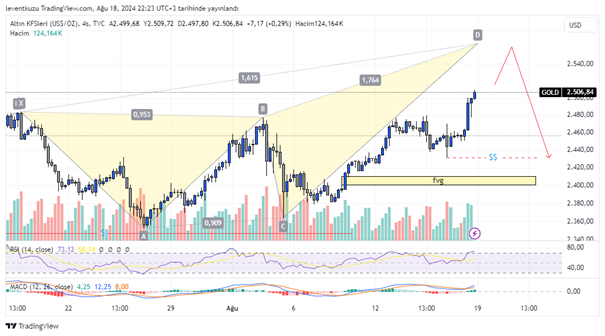
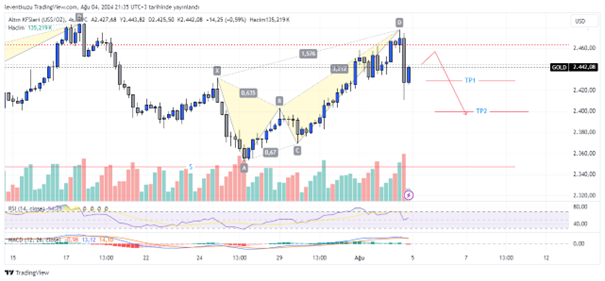
XAUUSD
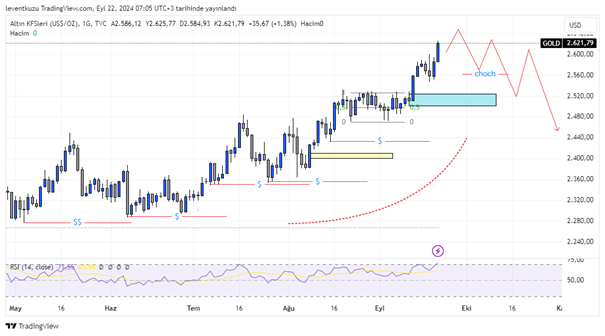
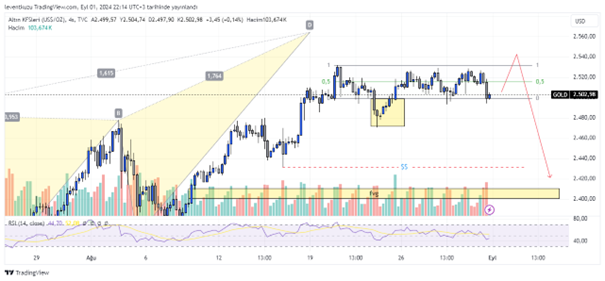
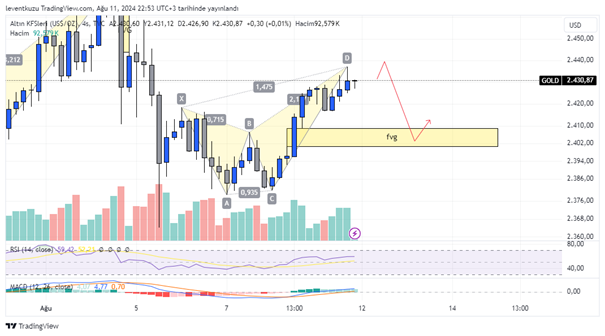
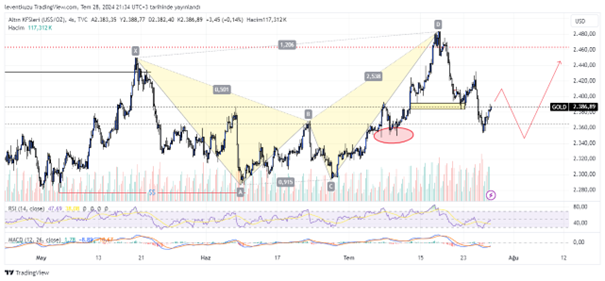
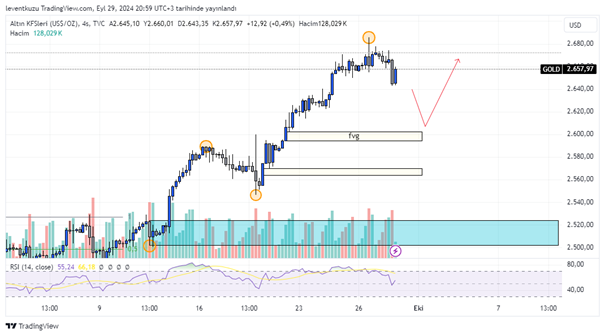
4H analysis
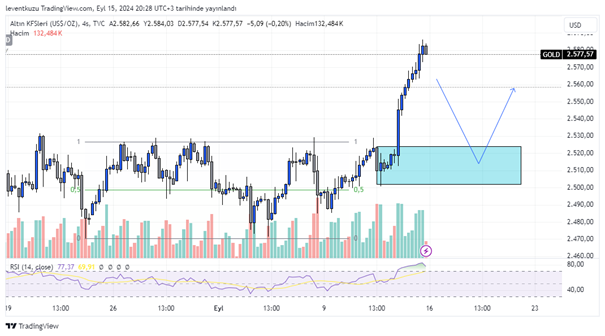
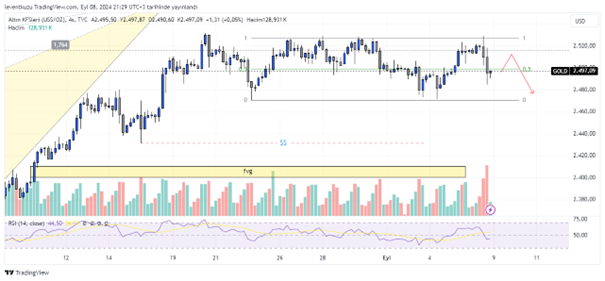
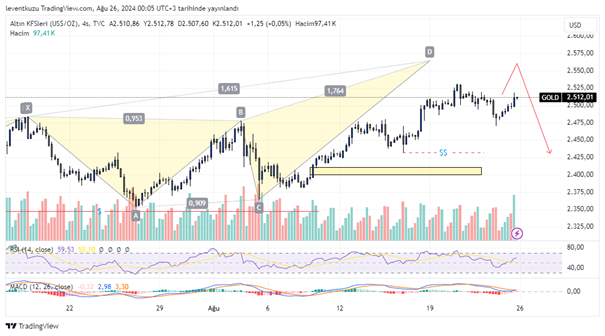
Swing low and swing high of point on the chart are shown for 4H time frame. Bullish trend is still valid and there is no sign of reversal right now. Therefore, we should expect the increase of the price. A candle close lower than the near wicks are available but this is only an internal liquidity removal. Also, recent FVG is filled. Latter FVG zones will be the target. Unless $2550 is broken downside, we expect the continuation of the bullish market structure.
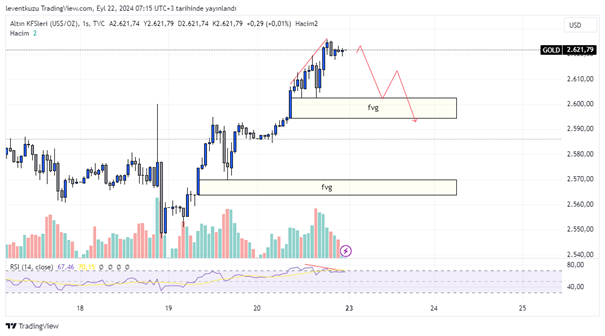
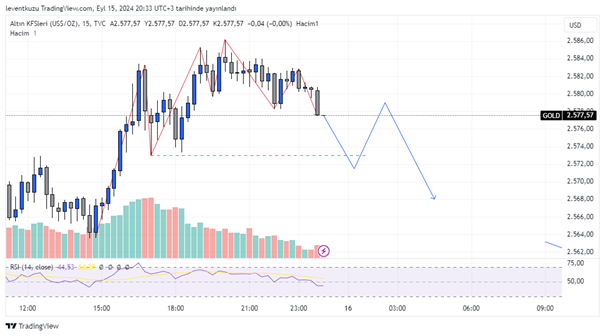
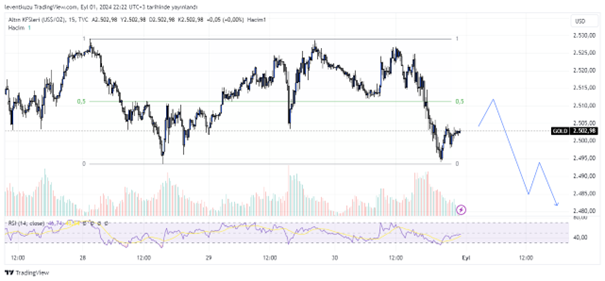
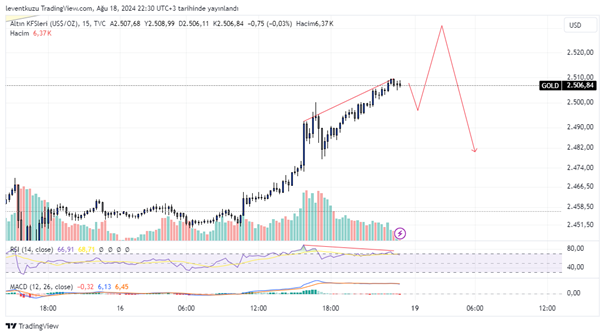
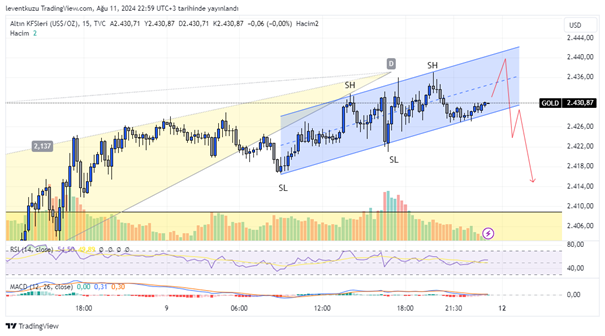
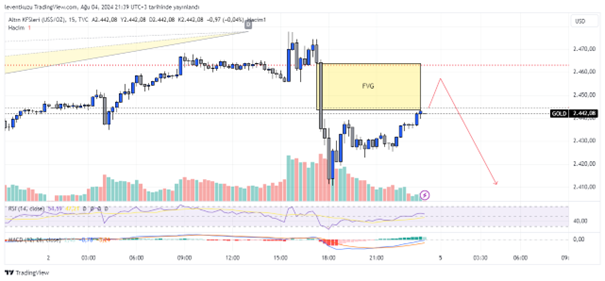
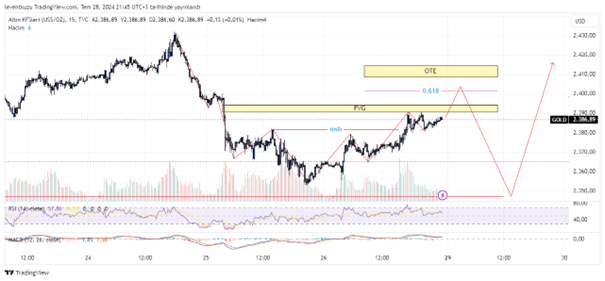
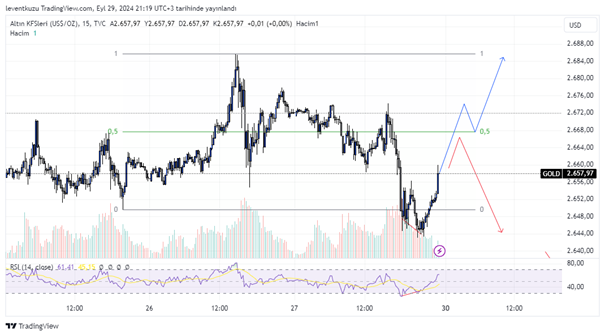
15 min analysis
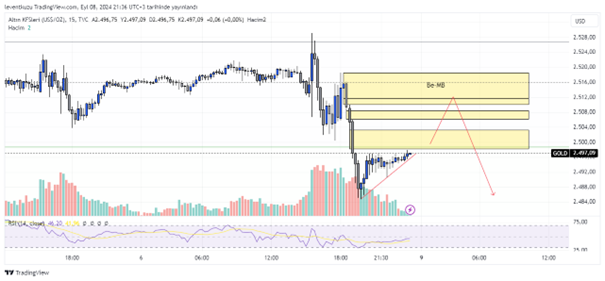
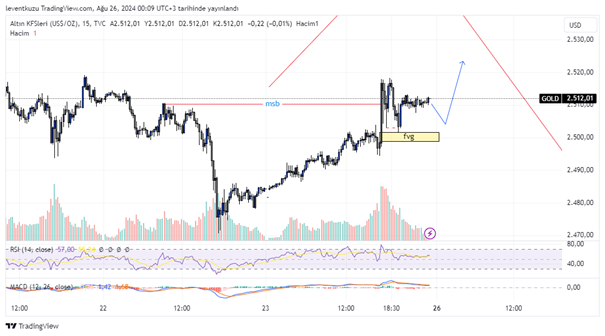
The price is within a range over the last week. Equilibrium and optimal trade entry zones worked well to push the price. Recently there was a deviation on the price. During the deviation movement, a bullish RSI divergence occurred. Then, price again entered the range and now will target the equilibrium. After reaching the equilibrium, we should observe the price movement whether it will be a long or short. Possible price paths are shown as different colours on the chart.
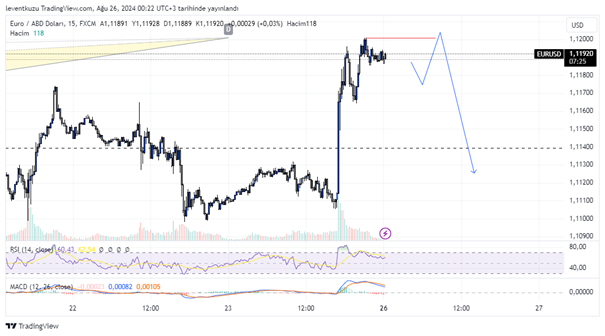
EURUSD
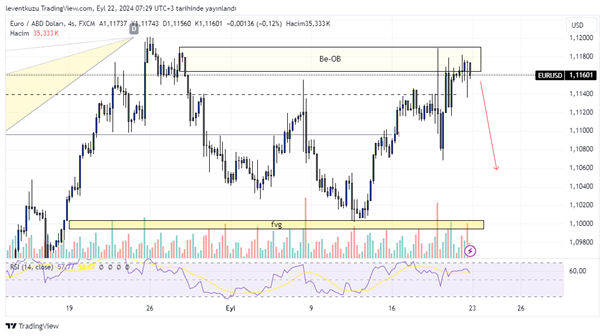
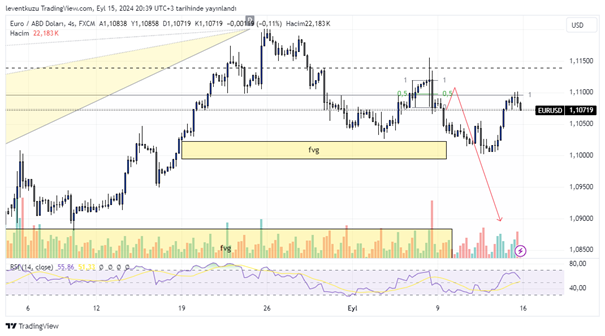
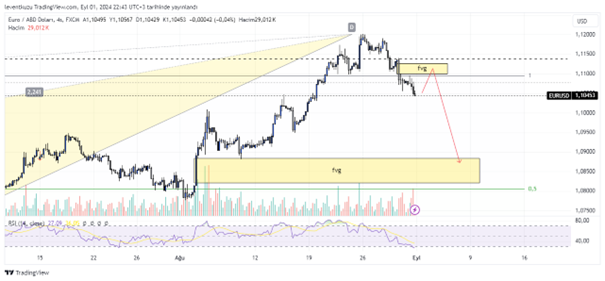
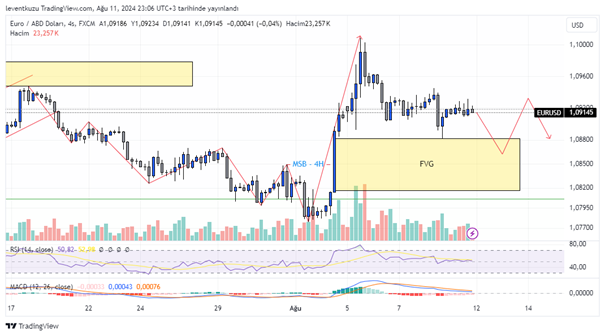
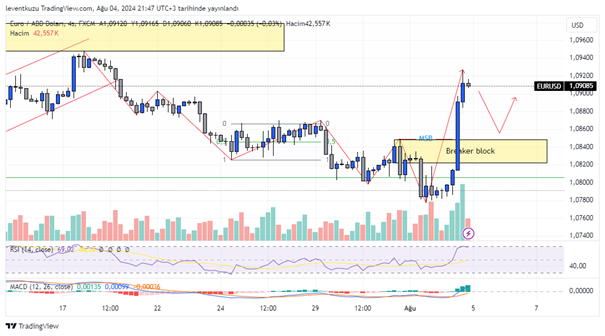
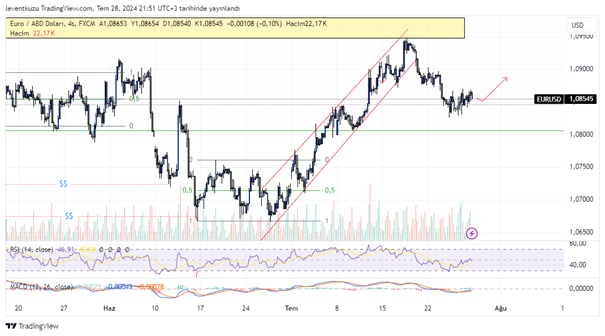
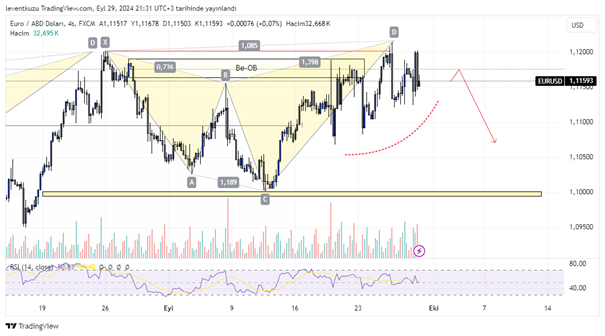
4H analysis
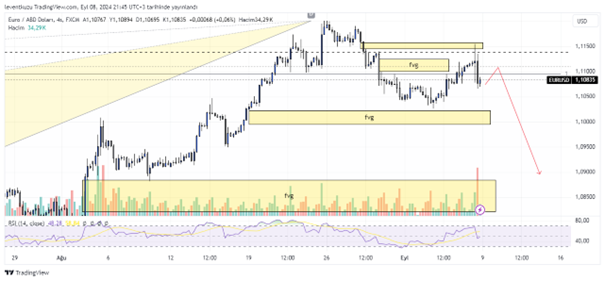
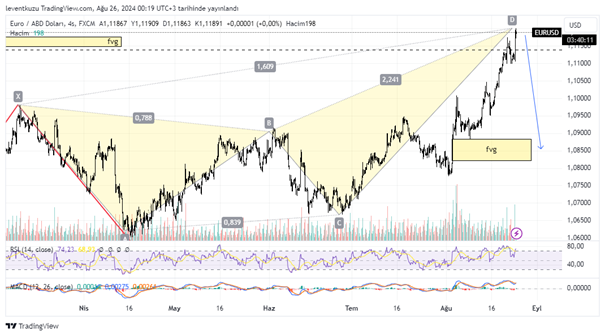
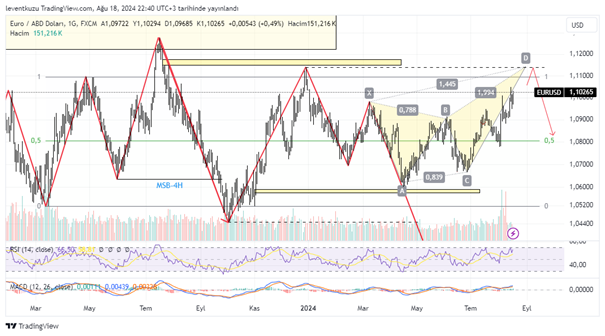
LTF chart of the last week was based on the possible reaction from the order block. It reacted well on the short time frame. However, order block couldn’t push the price to the sell side FVG. Instead of it several liquidities are accumulated between 1.107 and 1.113. The order block is removed and liquidity was swept on the top. These movements generated a bearish shark pattern. The liquidity pool shown by the dashed red colour will be the target.
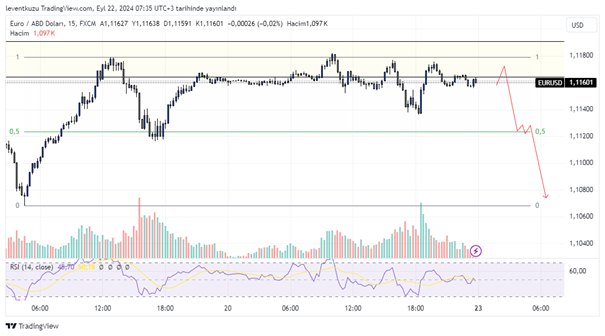
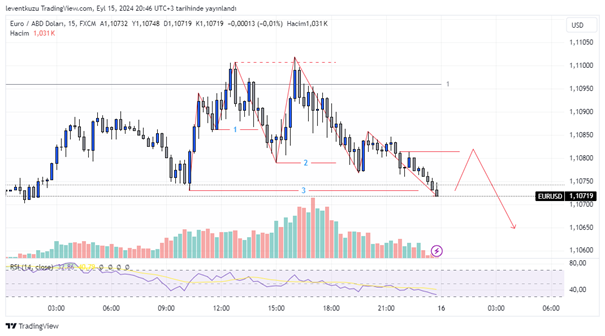
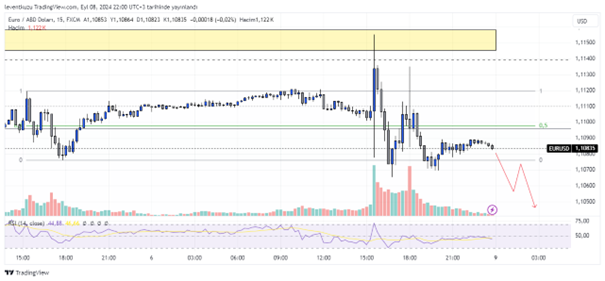
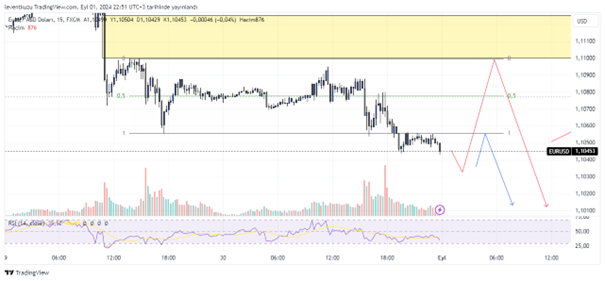
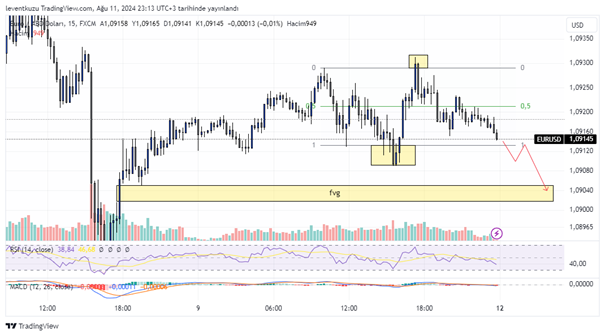
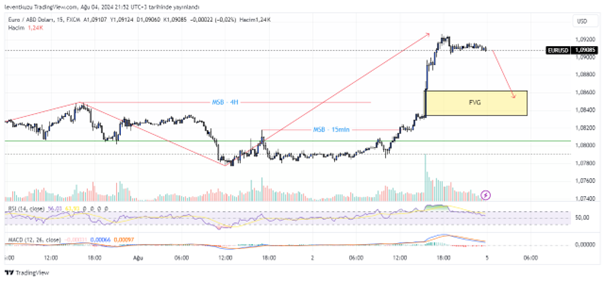
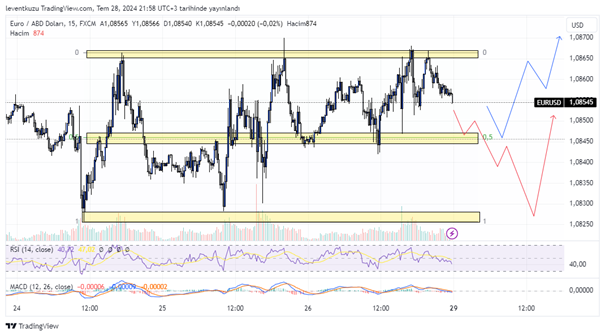
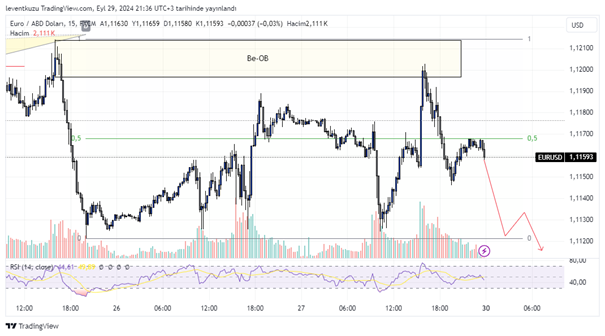
15 min analysis
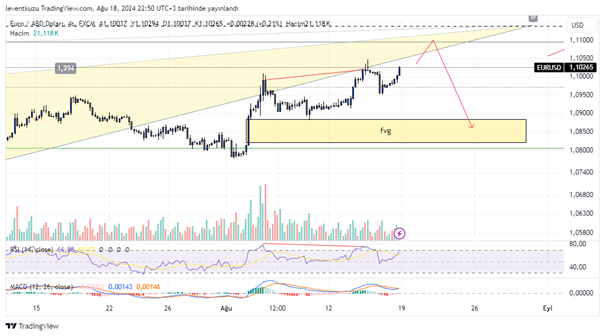
An impulsive downward price movement occurred on LTF chart. We spotted the order block and it seems that OB pushed the price again to the lower side. If we consider the impulsive movement as a range, we can see that equilibrium of this range, currently holds the price. Most likely price movement is shown on the chart by a red path. We expect the range low to be broken.
** Important Note: Above ideas are not investment advice!**