Categories
Overview

Weekly Market Update 06-05-2023

BTCUSDT

Daily analysis

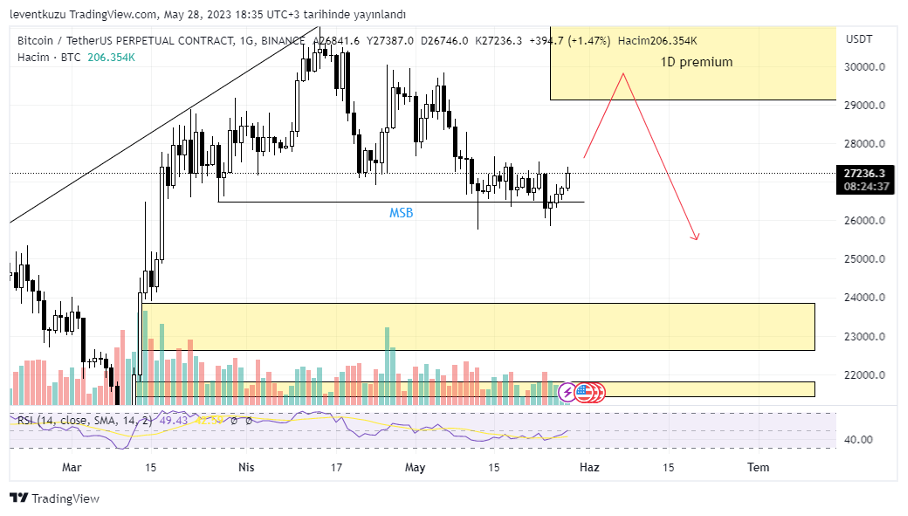
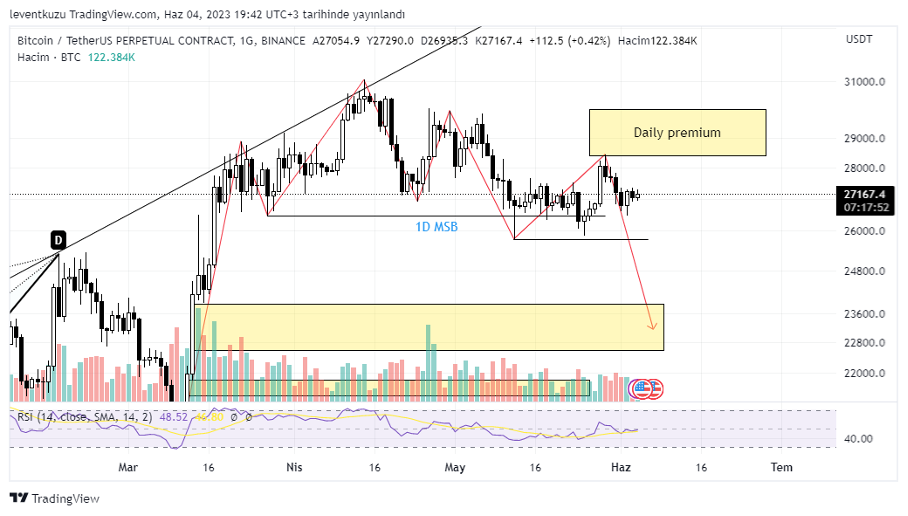
The market structure remains bearish as the last week. The price tested the daily premium zone just with a wick. On the daily chart $22,500 is the place to be filled to ensure the closure of imbalance. Discrete liquidity heat maps show liquidation areas around $22,000 level.

4H analysis

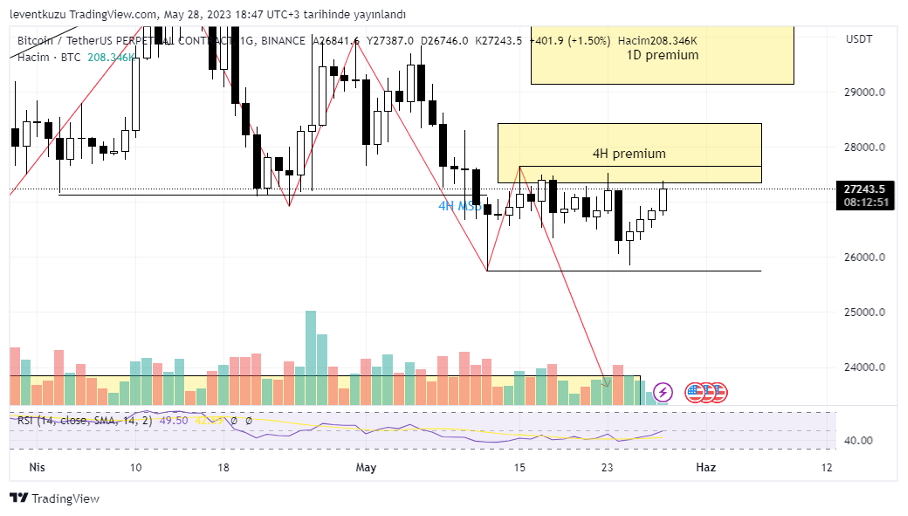
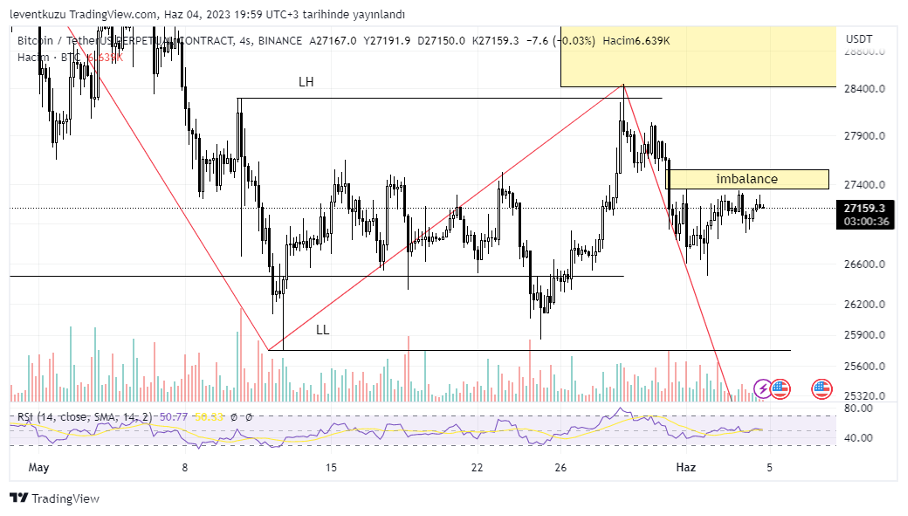
The price is between LH and LL levels from May 10th. The two levels also exhibit a price range. Currently, the price is on the EQ level. Also, RSI is on 50 level. The weekly close will be important in this case for possible manipulations. The above imbalance between $27,550-$27,350s can be considered as a decision zone for possible short entries. We can decide possible short positions within imbalance.

XAUUSD

Daily analysis

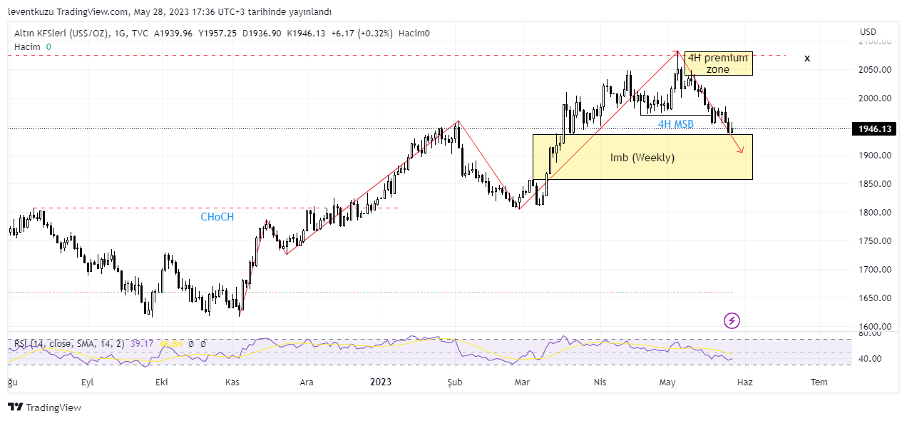
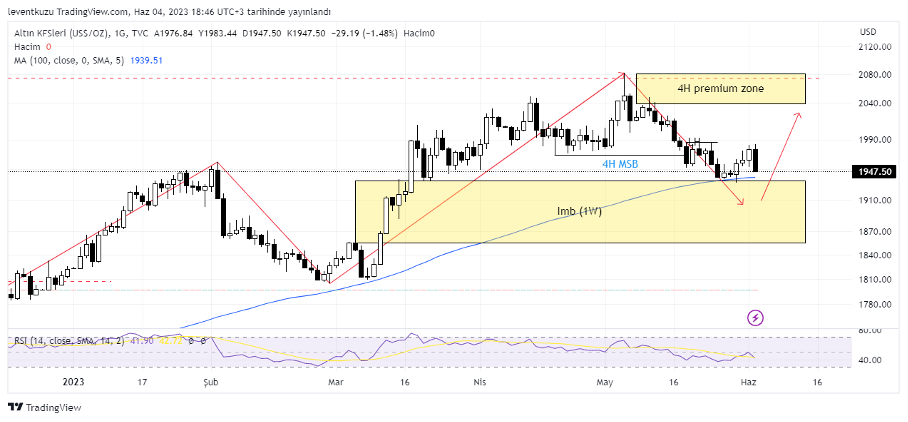
From the early May the price of the gold visited twice the weekly liquidity void. The last was this week and the price remained nearly the same as the close of last week. The price bounce was from the top of the imbalance level. It seems that that level is not strong enough to push the price upward. We may expect the price to get more liquidity from cheaper prices. In this case, 4H premium zone may be visited after reaching a lower price. On the other hand, the market structure will remain bullish as long as the price is above $1,800. Furthermore, MA100 remains a solid support line.

Hourly analysis

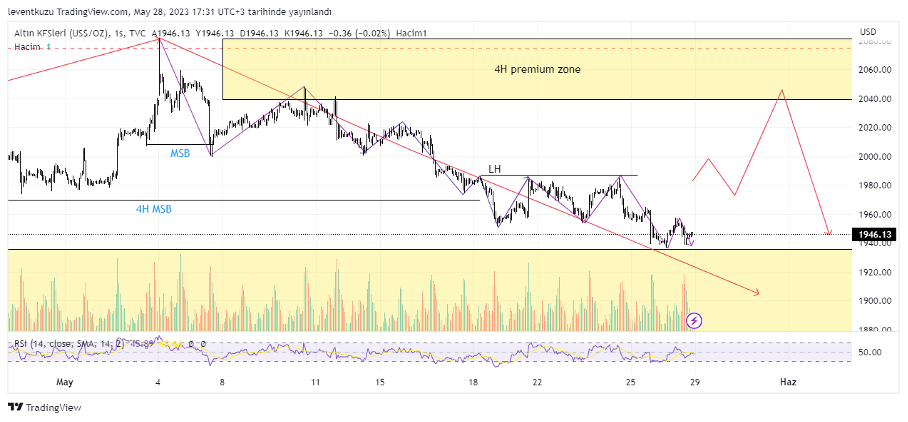
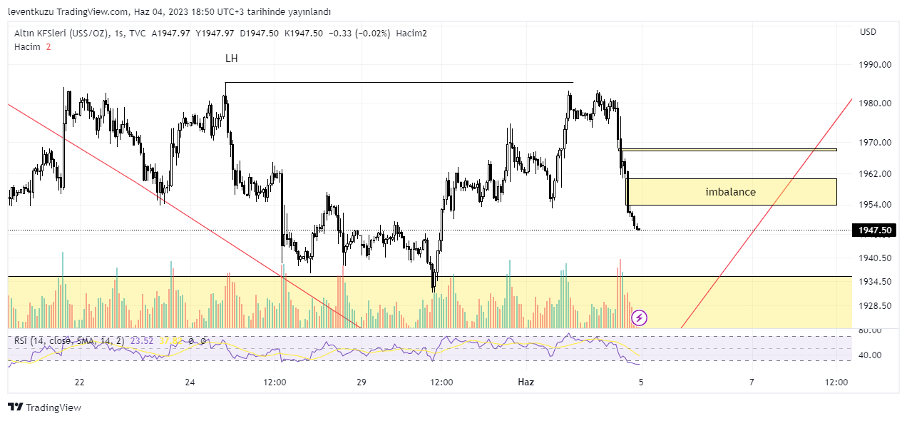
The market structure was bearish for the last three weeks on both 1H and 4H time frames. 1H LH level remains unvisited. If a liquidity wick would have been reached that value, then we would be sure of a possible short position. Furthermore, RSI is below 30. This can be sign for short range long entries until the imbalance zones over the current price.

EURUSD

Daily analysis 

Last week we expected the price to reach the imbalance level. Chart of his weeks clear shows the price movement and the imbalance was filled. On 4H time frame the price is bearish, however, we have a reversal trend for 1H. Further, explanation for lower time frames are available under the explanation of each LTF.
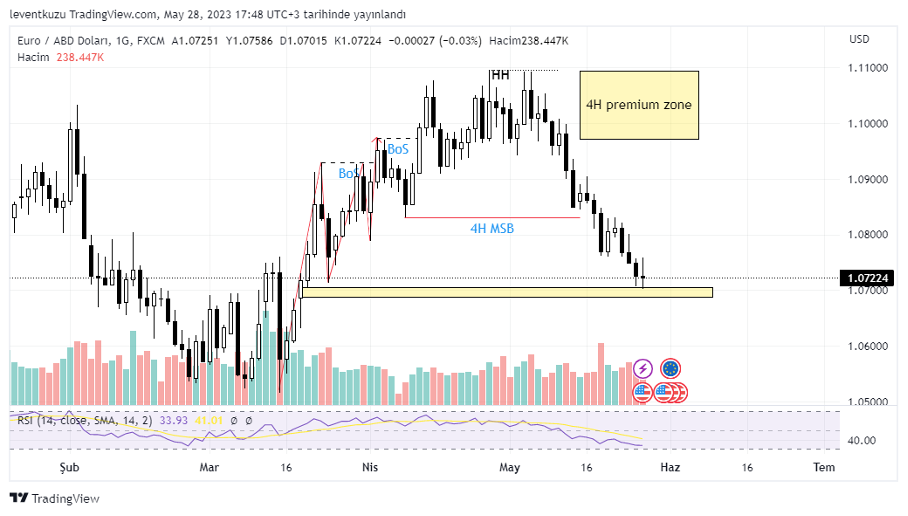
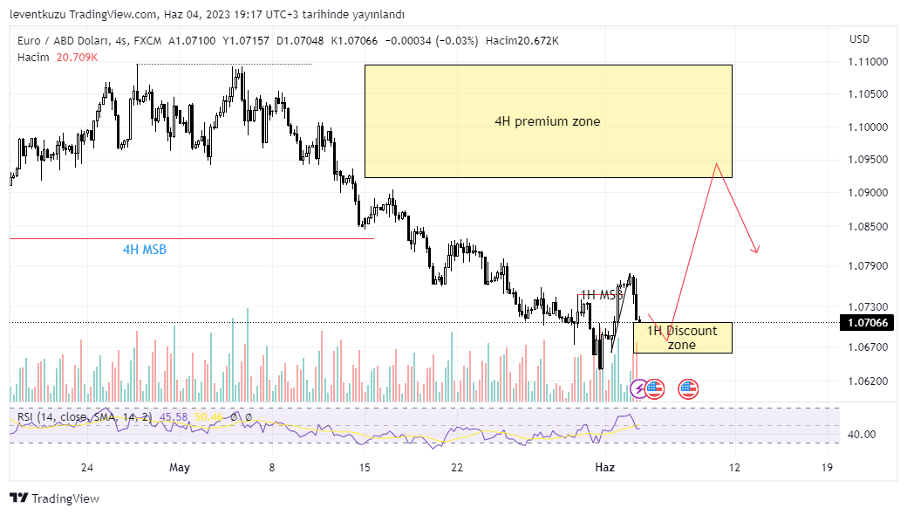
4H analysis

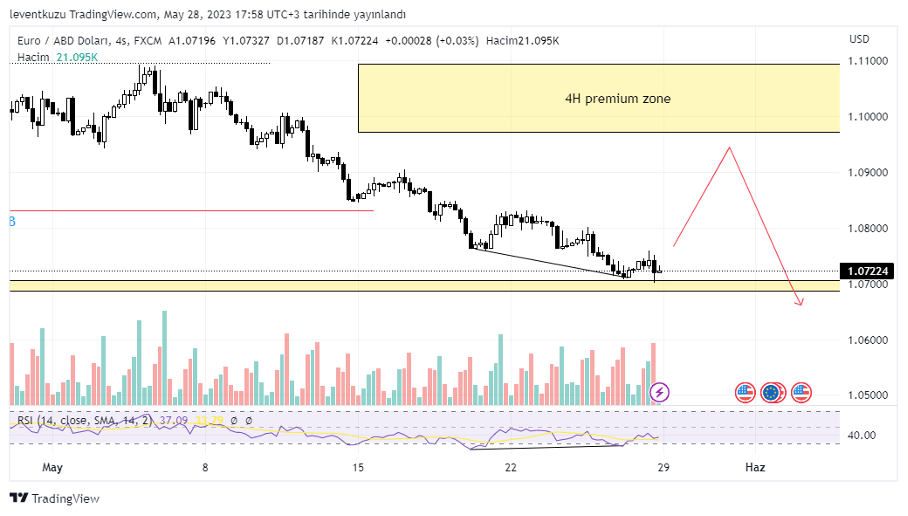
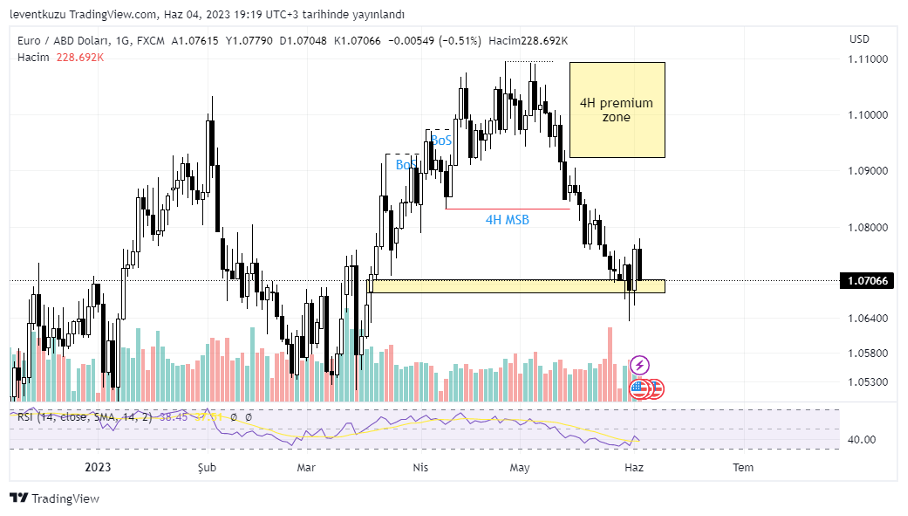
The EURUSD pair evaluated to be in bearish since the last two weeks. The bullish RSI divergence lead the pair move further price level. This made a market structure break on 1H. This can carry the price until 4H premium zone. Exact place for long entry can be available on LTF charts.
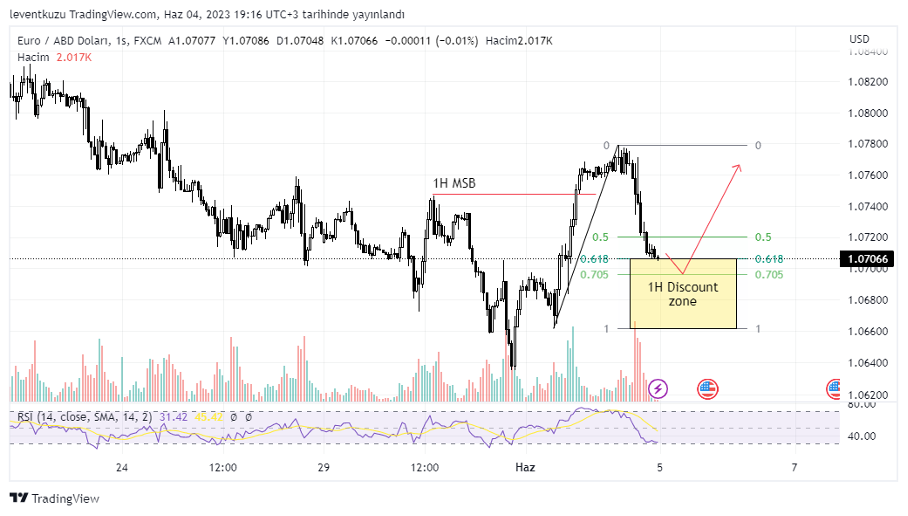
Hourly analysis

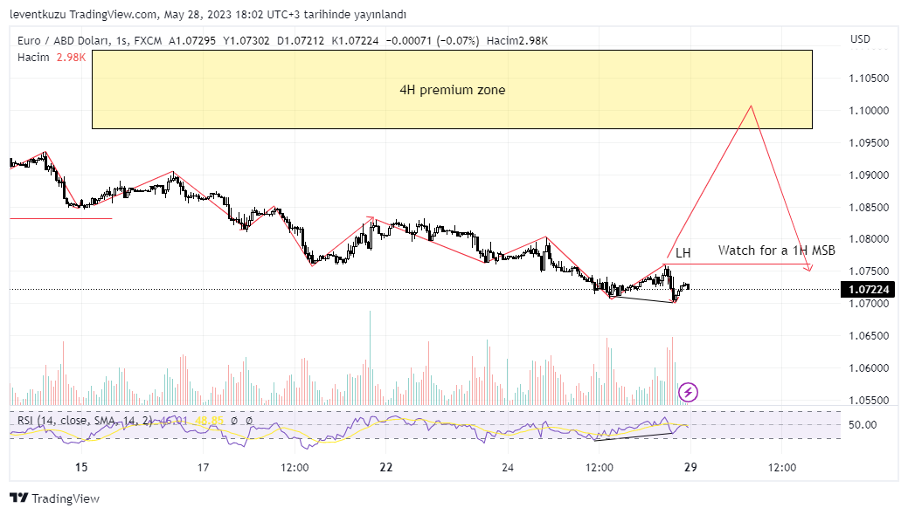
This week market structure turn to bullish on 1H time frame. The price reached 1H discount zone. Now we need 5 min confirmation for a possible long position to target upper levels. On HTF we expect 4H premium zone to be reached.

** Important Note: Above ideas are not investment advice!**

Nihat Çetinkaya
https://twitter.com/nhtctnk

I’m a private trader of over 7 years, based in Istanbul.
All trading and research are my opinion, not investment advice.

Categories
Overview

Weekly Market Update 05-29-2023

BTCUSDT

Daily analysis

The price was bullish from early March. Market structure shifted to bearish to lower time frames. This week, MSB occurred on daily. Now we have a new target for the daily chart. $29,000s is a new target for wing short positions. For retracements and short term long positions we should keep an eye on lower time frames. After hitting premium zone, imbalance zones and a liquidity zone until $19,600 level will be new targets.

4H analysis

After the formation of bearish market structure break, the price retraced to the premium zone of 4H structure. Also the price is between a range. LL and HL has not been broken. On higher time frame lower prices are the target. However, we can expect higher prices according to market structures on 15 minutes market structure.

XAUUSD

Daily analysis

From the early May the price of the gold drops steadily on daily time frame. On 4H, market structure break was formed. According to current price we are close to weekly imbalance level between $1,940 and $1,860. The price can partly or fully fill the price imbalance and then make a retracement to 4H premium zone. We need a MSB on lower time frames for bullish price movement into the premium zone. The market structure will remain bullish as long as the price is above $1,800.

Hourly analysis

The market structure was bearish for the last two weeks on both 1H and 4H time frames. Last week we expected a retracement move to the premium zone on 4H time frame. However, the market structure is still continuing to make break of structure on bearish side. The location shown as LH is important for price delivery to 4H premium zone. If a candle closes above 1H time frame over LH level, then we can benefit for a small long position until the premium zone, then we can enter short within the premium zone with a confirmation on 15min bearish market structure break. The position can be kept until 1W imbalance zone.

EURUSD

Daily analysis 

Considering different time frames one can observe that the market structure is bearish on 1H and 4H time frames. The price hit an imbalance zone and close to fill the gap. If we consider the RSI level, we can expect a reversal after closing the imbalance. The target will be 4H premium zone.

4H analysis

The EURUSD pair evaluated to be in bearish since the last week. We mentioned above that the price hit the fair value gap. Now, we have another confirmation on 4H time frame to expect a bullish retracement. The RSI exhibits bullish RSI divergence. We should observe a bullish retracement until 4H premium zone by a market structure break on 15 minute time frame.  This has to be a short term long position. Then, one can expect a short position in the premium zone according to bearish market structure break.

Hourly analysis

Bearish structure is present in the market on 1H time frame for a long time by making new break of structure on each lower high. As with 4H time frame there is bullish RSI divergence on 1H time frame. We are on a good position for a reversal on 1H time frame, which will take us to 4H premium zone. The price shown as LH is critical. If a candle closes above that level, then we can think that price made a MSB on 1H time frame and this is a retracement for 4H time frame. In this case the possible price movement is shown with red lines.

** Important Note: Above ideas are not investment advice!**


Nihat Çetinkaya
https://twitter.com/nhtctnk

I’m a private trader of over 7 years, based in Istanbul.
All trading and research are my opinion, not investment advice.

Categories
Overview

Weekly Market Update 05-22-2023

BTCUSDT

Daily analysis

The price was bullish from early March. One might think that the price shifted to bearish in early March but it was just TP2 of the bearish harmonic pattern. After reaching the target bitcoin price continued its bullish price movement. The highest price reached on mid-April. The price was unable to make a new high and a shoulder-head-shoulder formation is obvious from the chart. We can expect a price reversal. The important price is HL level. If a candle in daily chart closes below that level, then we can expect lower levels. There are several imbalance zones and a liquidity zone until $19,600 level.

4H analysis

$27,149 was an important level for the current time frame. The price closed down this level. The market structure shifted to bearish on 4H chart. The price reached 4H premium zone and kept its bearish movement. The RSI also shows the momentum decrease in the price. On the other hand, volume shows a decrease. All these are major indicators of possible bearish continuation of the price. Our expectations are the imbalance zones and liquidity under the current price. The major imbalance zone starts from $24,000 level. Discrete liquidation level heat maps shows significant amount of orders just below $22,000, which matches with the second imbalance level.

XAUUSD

Daily analysis

After the wick at $2,075, the price of the gold is expected to reach weekly imbalance between $1,940 and $1,860. Last week the price was $2,010, this week the reported value is $1,977. The price is moving in accordance to out expectations. There is a little price distance to 1W imbalance. After reaching this target, we can look for bullish price movement in lower time frames.

Hourly analysis

The market structure was bearish for some time. This week the gold price was also shifted to bearish on 4H time frame. Now we can expect a retracement move to the premium zone on 4H time frame. The location shown as LH is important for price delivery to 4H premium zone. If a candle closes above 1H time frame over LH level, then we can benefit for a small long position until the premium zone, then we can enter short within the premium zone with a confirmation on 15min bearish market structure break. The position can be kept until 1W imbalance zone.

EURUSD

Weekly analysis 

The harmonic pattern within the descending long term channel is unable to reach 0.618 level. Last week bearish MSB was formed on 1H time frame, this week MSB is formed for 4H time frame. These two time frames are important indicator for higher time frame possible shifts. But we should focus on lower time frame charts for possible short entry positions. If the chart goes bearish on 1W time frame, we can expect to reach the eq level of the descending channel, which is around 1.02.

4H analysis

The EURUSD pair generated a MSB at the beginning of May on 1H time frame. It made a BoS but the price was bullish on 4H. We noted a possible market structure break on 4H tie frame and draw a red horizontal line from swing low point. According to our expectation, market made a structure break on 4H time frame. Now we should focus on a short position. The best price to short this pair can be the premium zone located, which is between 1.097 and 1.109.

Hourly analysis

Bearish structure is present in the market on 1H time frame for a long time. Recently, the structure has shifted for 4H time frame. We are on a good position for a reversal on 1H time frame, which will take us to 4H premium zone. The price shown as LH is critical. If a candle closes above that level, then we can think that price made a MSB on 1H time frame and this is a retracement for 4H time frame. In this case the possible price movement is shown with red lines.

** Important Note: Above ideas are not investment advice!**

Nihat Çetinkaya
https://twitter.com/nhtctnk

I’m a private trader of over 7 years, based in Istanbul.
All trading and research are my opinion, not investment advice.

Categories
Overview

Weekly Market Update 05-15-2023

BTC

Daily analysis

Bitcoin, which was priced positively with the bank crisis, could not break the $31,000 band and was pulled back to the $26,000 band. Although it is cold weather in four hours, it is at a very positive level on a daily basis.

In addition, I would like to point out that the price, which has made very strong and unbalanced outputs, needs to cool down a bit and reach the balance again. It is quite normal for him to want to reach the first pink box on this occasion. In possible declines, the $24,500 band is our first support, and the $31,200 band is our first resistance. I would also like to state that the price testing the pink area will bring a negative atmosphere to the market.

4h analysis

Bitcoin failed to protect the bottom that it needed to protect in order to continue its rising trend in the 4-hour time frame and closed below.

However, the strong reaction from the lower support zone shows that this zone is covered by the buyer block. In addition, the lower peaks made the trend weaker. In order to create a new and healthy trend structure, it needed to take strength from the lower side, and now it seems to have done it.

Important support is the $26,000 level.

EURUSD

Weekly analysis  

A descending channel was formed in the weekly chart and a harmonic bullish crab was present inside the channel.  The price was trying to reach exactly the TP-2 line and premium zone for two weeks. But we can talk about a reversal in lower time frame now. The state of the RSI also shows us the intention of the long buyers, which may no longer want to long their positions. The price isn’t expected to reach TP-2, just a wick can reach TP-2.

4H analysis

The price of EURUSD was between a range for about three weeks after two consequent bullish BoS movements. In this time frame the price is still bullish, however, we should care about a change to bearish market structure. Because price bounces twice from MA200 but it was unable to hold the price over and now it is below MA200. A retracement occurred to the average curve. This can be regarded an approval for the price character change. According to smart money concept we have to look at the red horizontal line which can show us a change of character if the candle stick body closes under that level. So the important level is $1,083 for 4H time frame.

Hourly analysis

Bearish MSB formed in the hourly chart, the price reached the premium zone. After testing the premium zone, price continued the bearish structure. Bearish BoS formed and a bullish retracement can be expected to close the imbalance between $1,088- $1,086. Then, we may expect to move towards lower prices and This will make a market structure shift in 4H time frame.

XAUUSD

Daily analysis

After the wick at $2,075, the price of the gold is expected to reach weekly imbalance between $1,940 and $1,860. Last week close was $2,015, only $5 higher than the current price. A small profit is available for swing positions. It should now be noted that the pattern is bullish in daily, we are on a price retracement.

Hourly analysis

According to hourly price chart, we expected to fill the imbalance of the price and then take short positions. The price moved somewhat further but couldn’t reach the premium of the hourly price retracement. Since the price has turned to bearish in 1H, we continue our short bias until a new MSB. Price expectation of the last week is also available on the chart. Below, around $1,940 our new target is available in higher time frame.

Categories
Overview

Weekly Market Update 05-08-2023

BTC

Monthly analysis

In the monthly chart, we see a price that has not yet entered the expensive area. The $32,853 low before the sharp decline and the $0.5 level of $32,690 overlap each other. It’s 15% higher than where we are now. When the price comes to this zone, it will make a retracement move in its monthly move.

We can say that the area where the price will see resistance is between $32,690 and $32,853. The first area to find support in the monthly view is $25,350.

Weekly analysis

On the weekly view, there is an FVG formed after retesting the downtrend. $24,511 is the region where we will find support on a weekly basis. We will see if it will get support after seeing resistance from the upper band, or if it will first pick up the buyers who cannot trade here and push them up.

Daily analysis

When we look at the daily view, we see a Propulsion Block (orange box) inside the weekly FVG area. BTC often responds to this structure. The $25,200 – $23,890 range is a solid support zone. The place indicated by the X above indicates that the liquidity left before the sharp fall is taken. This shows us that a price has released new liquidity. On the daily, we can identify the $31,060 – $30,360 range as the region where the price will find resistance.

4h analysis

In the 4-hour view, when we look at the longest price action, we see that sales are in the expensive zone of $30,140 – $29,415. However, an untested Order Block appears above. We are likely to see a rise to the $30,133 – $30,450 range. There is a liquidity left between  $27,140 – $26,900. I think it will get a reaction when it comes to this region.

XAUUSD

Daily analysis

Until the early April we were expecting a rise in the price of gold. The target was $2,075, which is a liquidation level. In the forthcoming weeks there was a decrease in the momentum of the price. Therefore, we expected to reach $2,075 after repairing weekly imbalance between $1,940 and $1,860. However, $2,075 was wicked in the first week of May. Now this is a confirmation for probable short positions. On the other hand, this is an ATH level. In the daily, price can reach predefined weekly imbalance. The strength of the buyers will determine the fate of bullish or bearish price movement. It should now be noted that the pattern is bullish in daily, we are on a price retracement.

Hourly analysis

The price had been in a range since April 19th until May 2nd. After the break of the range, price wicked the liquidity level, which was a good indicator for short entries. This allowed us a 3% profit. MA200 of the hourly chart now holds the price. As RSI is in the oversold region and there is an imbalance until $2,033, we can expect a small rise in the price within the imbalance. We can further expect a decrease in the price. Because the market structure is bearish in hourly time frame, whereas it is still bullish in daily as mentioned before.

EURUSD

Daily analysis 

The EURUSD price is a bit higher than the last week’s price and tested 1.11 with a wick. TP-2 target still exist for bullish crab harmonic pattern and 1.1% higher than the top of the wick. RSI level is 49, still in the mid-zone This is a positive indicator for the price to reach TP-2 level. Price would want to reach the premium zone.

Hourly analysis

Last week we identified a liquidity trap by taking the liquidities at both swing high and low regions. The same exists this week again. There are two consecutive market structure breaks. Finally, the price was bullish. The price reached a discount zone which is between fib 0.618 and 1 levels. A rise at least the imbalance between 1.06 and 1.075 is likely to be reached. Further BoS is possible since we expect TP-2 of the harmonic pattern in higher  time frame.

Nihat Çetinkaya
https://twitter.com/nhtctnk

I’m a private trader of over 7 years, based in Istanbul.
All trading and research are my opinion, not investment advice. 

Categories
Overview

Weekly Market Update 05-01-2023

BTC

4h analysis

In the 4H view, I think that the liquidity and price gaps left at the bottom are considered as a long-sided reaction trade. I think it will retest here because of the liquidity left above the orange area (Recliming Block). I will act according to the momentum of the price coming here.

Daily analysis

The only possibility that we can say that we continue to rise in price is the closings above the green line. The first level we can see when 33k remains is $39,850.

Weekly analysis

In the weekly view, we see that it broke the falling trend with the reaction from 50%, retested it and continued. The last low before the breathless drop (upper green line at $32,917) means a bearish retest for me.

Monthly analysis

In the monthly view of BTC, it received the expected reaction from the 50% of the bull season that started with the pandemic.

What we learned shows us that the price below 50% is cheap. But is this enough to rise?

Again, looking at the monthly view, the pandemic rise started with an OB (orange box). Above is an untested OB in the circle. This is the region where I will wait for a new bull season.

XAUUSD

Daily analysis

As of March 30th daily chart still remains bullish in terms of market structure. In the evaluation of the last week, we pointed out the bearish RSI divergence, but in the current case we have no more active divergence. The price change is quite low with just a $7 decrease. Price fluctuation is also quite shallow, a deeper look in lower time frame is mandatory in this case.

Hourly analysis

The price seems to move inside a range, which is between $2,010 and $1,970. The last price is at 0.5 level of the range. The liquidity of $2,075 over the price and weekly imbalance at $1,935 below the current level remains active. Current situation in the hourly chart is unclear and break of the range is required to identify the path of the price. After the expansion, retest of the range can be place to start a short or long position.

EURUSD

Daily analysis 

The EURUSD price is a bit higher than the last week’s price and tested 1.11 with a wick. TP-2 target still exist for bullish crab harmonic pattern and 1.1% higher than the top of the wick. RSI level is 58, still in the mid-zone This is a positive indicator for the price to reach TP-2 level. Price would want to reach the premium zone.

Hourly analysis

Last week we identified a range formation in the discount zone of the bullish up leg retracement. The price moved over fib 0 level and kept a bullish price movement. After retest of the range zone, liquidity of the HH was taken. In the continuation, the liquidity of the last swing low was also taken. This two consecutive liquidity movements show us that stop-loss for buyers and sellers were activated and a trap was in action for those who had their close orders.

Now the price can make a new high since no bearish structure break is available.

Categories
Overview

Weekly Market Update 4-24-2023

BITCOIN

Monthly analysis

Bitcoin opened the first red candle after touching the upper region, which is an important area as we mentioned last week in the monthly view.

Our strong resistance areas of $32,600 and $36,600, closes above these levels will move towards the $42,000 – $48,000 resistance, respectively. Before that, our expectation will be a recovery with some pullback.

Weekly analysis

At the time of this writing, Bitcoin had not yet had a weekly closing. In the current pre-closing situation, it shows bearish signs with correction levels starting with the engulfing candle.

The $22,100 region can be considered as a buy area. Considering the trend continuity, we can think the price will move upwards from this region.

Let’s not forget these pullbacks in the price are normal.

Daily Analysis

When we examine the daily chart, we see the structures formed are predominantly in a downward trend.

It may be thought the market structure will begin to draw the downward forms with the cutting of the region between the last peak and the bottom. First of all, unless there is a close below $26,800 and there is an increase to the $29,300 band, short selling transactions will increase in that area.

It is recommended you do not take drastic actions in that area.

Hourly Analysis

On the hourly analysis, even though the market structure has not been broken up as a result of some purchases after the last 3 flow movements, it continues to make high bottoms in itself.

Current support areas are at $27,107 and $26,800, while resistance is at $27,800.

After the last double bottom and 2.618 formation, I think the target determined by the arrow sign will go as long as it does not stay under the red shaded area.

Our analyses is not financial advice.

XAUUSD

Daily Analysis

As of March 23th, the daily chart still remains bullish in terms of market structure. In the evaluation of the last week, we pointed out the bearish RSI divergence, which is a possible sign of a reversal trend. Now, we have another confirmation in exponential moving average cross on the 1hr graph analysis. But it will be highlighted under hourly analysis section. The price of gold reacted once from the EMA200 level. As the price started declining again we may expect to reach the same level this week, which will also intersect weekly imbalance.

Hourly Analysis

The price couldn’t react $2,075, which is a liquidity level.  Market structure break formed in the 1hr time frame. As the price was over the EMA200 in this time frame, now it remains under this EMA level, which supports the notion we are on a correction wave. The correction can reach down the 0.618 fib level on a bearish wave, which corresponds to a price of $1,900. At this level we should decide the possible price move.

Overview of the Weekly Chart

In conclusion, we now have a bearish 1hr trend in gold. This translates to the price can reach $1,900. Here we have to make observation in lower time frames. If the price keeps its downtrend, we have to keep our short position. In the case there is a market structure reversal on the 15 minute chart, we may expect another uptrend until the liquidation level at $2,075.

EURUSD

Daily Analysis 

The EURUSD price is the same with last week’s price at 1.099. TP-2 target still exists for bullish crab harmonic pattern. We have somewhat lower RSI than last week’s level. This is a positive indicator for the price to reach TP-2 level. Price would want to reach the premium zone if that happens.

Hourly Analysis

The price keeps continuing the break of structure moves, which is the sign for bullish price continuation. The price formed a range after reaching the discount zone of the last bullish up leg. There is not an important deviation/break in the price. In this case, we should consider range formation.

Two important liquidity levels exist in the range. Reaching fib 0-1 levels will show us a possible LTF move of the price. If liquidity is taken under the fib 1 level by just a wick, this will be a sign for possible bullish move of the price.

Nihat Çetinkaya
https://twitter.com/nhtctnk

I’m a private trader of over 7 years, based in Istanbul.
All trading and research are my opinion, not investment advice. 

Categories
Overview

Weekly Market Update 4-17-2023

BTC

In our weekly market analysis, we came to an important region at $31,600-$32,600, which has been considered support many times in the past.

Since this region has been support many times before and then been broken, it is now strong resistance. In this sense, this region may appear as a resistance area which can be the continuation of the downtrend. For this reason, if purchases will be made in this region, resistance breakdowns should be followed. This region is a profitable area if purchases have been made before.

On the daily charts, the market structure is trending upwards but we need to follow the pullbacks. Our retracement area is the red shaded region, when this region comes, if we observe a movement on the last peak in the 4hr time frame, we can start to take upward trades.

Bitcoin continues in the buyer zone in the 4hr timeframe. We will continue to take up trades as we see 15min reversals in this timeframe. It may want to fill the FVGs in the lower area later, so let’s try not to take any upward trades unless we see turns in the red zone.

On the other hand, the US House Committee Publishes the Stablecoin Law Draft. The drafted law, found on the committee’s hearing page, will represent the first major crypto legislation to be moved in 2023.

There was a pullback due to the breaking of the wedge on the Bitcoin 1hr timeframe. In addition, the market structure is broken on the 1hr timeframe and our ideas of the market will fall will become more prominent and in the foreground. For this reason, let’s be careful not to take up transactions in the short-term.

EURUSD

Daily Analysis  

Last week the price was closed at 1.089 and we expected a rise until “take profit-2” zone. The price followed this path and current level is 1.099. We will keep this expectation until the price is 1.12. As it was mentioned earlier, this price is the final target of bullish crab and retracement zone for the last down leg of the price. At 1.12 it is considered to be in the Premium zone.

Hourly Analysis

In the bulletin of the last week, we identified a discount zone for the current bullish trend. The price came into the zone and here reacted well. Price kept its bullish trend upwards and obeyed our expectations. Price started to lose its momentum as we are close the Premium zone in higher time frame but still there is not a change of character of the market. You can consider that we are in critical zones and start taking profits in the long positions as price increases.

As a result, we can consider short positions as long as we reach 1.12. But the position should be opened carefully by confirming your decision in lower time frame by a market structure break.

XAUUSD

Daily Analysis

Daily chart still remains bullish as it has made a break of structure. But the present condition of bearish RSI divergence should warn us to be careful for a possible market change. As mentioned earlier this situation shows the unwillingness of buyers for making new bids. Imbalance under $1,890 can be a target for price retracements.

Hourly analysis

Last week we expected the price to reach a possible liquidity zone at $2,075 after filling the imbalance. The imbalance is removed in current case but due to the momentum decrease in higher time frame, price is now likely to take liquidity in $1,950. After this reversal, we can expect the increase of gold price.

Overview considering weekly chart

Although BoS is formed and did not change its character, lower time frames suggest us a possible reversal. Weekly candle represents an indecision for the price. Deeper price imbalances are present in the weekly chart. All different time frame evaluations support 1hr possible price path.

Categories
Overview

Weekly Market Update 4-10-2023

Although Bitcoin has not yet shown a serious movement on the monthly chart, our analysis made last week is valid.

We can think that its continuation as a red candle after the monthly opening may bring along relatively medium-term correction levels.

Our support levels that we need to follow on a monthly basis

It comes out as $23,700, $21,600, $11,800.

While Bitcoin’s movements continued in a certain range in the last 3 weeks, MicroStrategy bought 1,045 Bitcoins for 29.3 million dollars, increasing its total assets to 140,000 BTC, which exceeds 12.6 billion dollars. However, the fact that this news has not had any effect on the price of Bitcoin and the levels are still not exceeded, may be a harbinger of hard movements in Bitcoin.

In this sense, it will be healthier not to receive loaded transactions without leaving the range it is in.

If we look at the weekly candlesticks, we are in areas where volumeless price movements continue and it is not possible to make a clear direction forecast.

As a region, it would be worth mentioning that Bitcoin price has the potential to pull back since it is located within the resistance areas.

In the daily view, the resistance level of $30,800 has not been tested yet, and it is possible that short-term prices will be pushed into these regions, violating the liquidation levels for futures traders. I think you will understand what we want to say clearly by adding the liquidation graph in the sub-area.

Besides, our daily support zone is $26,868, $25.546, $24,730.

Bitcoin liquidity map

This chart shows the liquidation areas of traders using 3x, 5x, 10x leverage. It shows the liquidation areas for both long and short positions, i.e. for both buying traders and selling traders.

Bitcoin is expected to rise to the $28,480 band in the 4-hour timeframe, followed by a retracement of $1000 and a decrease to the $27,000 band.

As a result of the last 1-week analysis, we observe that it has not been able to make new peaks, which indicates that the volume and purchasing power have decreased, and that the expectations are bearish.

We can state that as long as the price continues in the symmetrical triangle range, it cannot become clear and will form a net price only if it goes out of the area.

Triangle forms indicate that whichever direction the breakdown takes, it will come to that region with a focus on selling or buying.

Our short-term support area is the $27,700 resistance area at $28,500.

EURUSD

Week Analysis

In the weekly structure, it is seen that the price is in a decreasing trend within the channel. In some places, the response of the EQ (0.5) region, the midpoint of the channel, and the price holding support the validity of the channel.

Daily

The price has formed a bullish crab on the diary and has passed the first profit point. The second take profit point is around 1.12. At the same time, since this place has passed the level of 0.618, possible price movements on it can be considered as a seller zone.

Hour

The bullish look continues in the hourly structure. With the continuation of the structure breakdown, the price of 1.12 in the next upper time frame can be visited. As a secure entry zone, reception can be made from the receiver zone between swing low and swing high in the existing structure. For positive confirmation, support should be taken from the 5-minute chart.

Gold Overview

Weekly

The positive trend continues under weekly. In December 2019, the correction of the propulsion movement was finished, creating a new structure break. It made a new peak in August 2020. This peak has left liquidity and has not been taken yet. At its current location, the price is close to both the underlying price gap and the liquidity zone.

Daily

After the price made an upward market break in the daily process, the Fibonacci retracement received a reaction from the region within the 0.618-1 levels and continues its upward movement. When the current price is monitored, the liquidity at $2,075 seems more likely to be taken. However, after the voluminous rise last week, when the RSI is also observed, it is likely that the price will either buy liquidity or pull back a little beforehand. The RSI is falling in response to the rising price, which suggests that buyers are less willing. The price retracement can be considered as a buying opportunity because the positive structure of the market continues in the high time frame. Explanations were made in the hourly time frame for the possible points that the price could reach.

hour

At the time of its evaluation last week, the price made its last liquidity purchase before $2,075. All that remains is to take the last liquidity above. Just like on the daily, the hourly RSI is in a descending trend. With the pullback of the price, it is expected that the imbalance will be filled completely or partially, the RSI will come to the oversold region and new buyers will step in and reach the above target.

Nihat Çetinkaya
https://twitter.com/nhtctnk

I’m a private trader of over 7 years, based in Istanbul.
All trading and research are my opinion, not investment advice. 

Categories
Overview

Weekly Market Update – 4-3-2023

A structure that caught my attention began to form in Bitcoin’s monthly view. It seems that it has tended to retest for the double top formation, which had previously broken down to the $16,000 level of Bitcoin.

After testing the $30,400 areas into the next week, it seems possible to face a possible pullback. We can follow our monthly support areas as $26,400 – $25,200 – $23,800 – $21,400.

It can be observed that if the breakdown of these areas occurs, the regions will be considered as S/R regions and will work as resistance.

On the other hand, there has been much positive news in the market recently that Bitcoin can reach the level of $ 30,000, while some factors limit this situation. Among them may be the banking crisis, which supported the rise of BTC by 20% in March.

In this process, where the banking crisis continues, Europe’s 2nd largest banking crisis occupies the agenda. After the crises experienced by Credit Suisse, the past few week’s decline in the shares of Deutsche Bank, Germany’s 2nd largest bank, has worried investors.

With candles showing weakness forming on the weekly Bitcoin view, we can observe a pullback to $24,700. As a long-term RSHS (reverse shoulder head shoulder pattern ) target, the $48,000 level draws attention.

$24,700 is a test area of the recently broken neckline. If that area comes and there is no serious sell pressure in weekly structures, it will continue on its way upwards with the continuity of the trend.

In the general structure, Bitcoin tries to maintain its upward trend. It is considered a buying opportunity unless there is a price below $21,400 which is then becomes a bearish zone.

If we interpret the 4-hour chart of Bitcoin, we can say the price continues in a certain range with volumeless candles due to the weekend and being in a strong resistance zone.

The breach area of the EQ region within the range where the price moves is at $27,600, closings below this level are foreshadowing the levels of $26,700.

In general terms, Bitcoin gained a good momentum before and during March, and as a result, altcoins also made serious exit opportunities. While most of the altcoins maintain their buying levels, some did not reach the sufficient level of buying due to their high prices. Considering the bull and bear cycles, it is ideal to invest in risky products with these price zones accounting for 25% of the long-term portfolio.

After MicroStrategy announced its debt to Silvergate Bank with Bitcoin, it was revealed they adopted Bitcoin as a long-term safety asset.


Nihat Çetinkaya
https://twitter.com/nhtctnk

I’m a private trader of over 7 years, based in Istanbul.
All trading and research are my opinion, not investment advice.