Contents
BTC Overview (Long and Short Term TA and Policy)
This week (1/9 – 1/15) was the most volatile in recent memory for BTC, a change from last week’s fully reduced volatility.
Although it is not clear whether the trend has changed from a downtrend to an uptrend, the market sentiment has improved and may be shifting to a situation where it is easier to get money into the market than before. In other words, we may be prepared to take positions in altcoins other than BTC. Volatility has also comeback somewhat, so I will be looking to take positions in the next week or so.
It is necessary to continue to watch the movements of BTC, ETH, and US100 and respond flexibly to the market environment at any given time. It is important to make a comprehensive judgment by observing each factor in a complex manner. Since monetary easing has temporarily ended, funds have been withdrawn from the market, and the U.S. dollar is strong, there is no need to be in a hurry to build buying positions over a long time horizon. This is a phase to protect funds, not the phase to be on the offensive. (repost)
BTC Overview
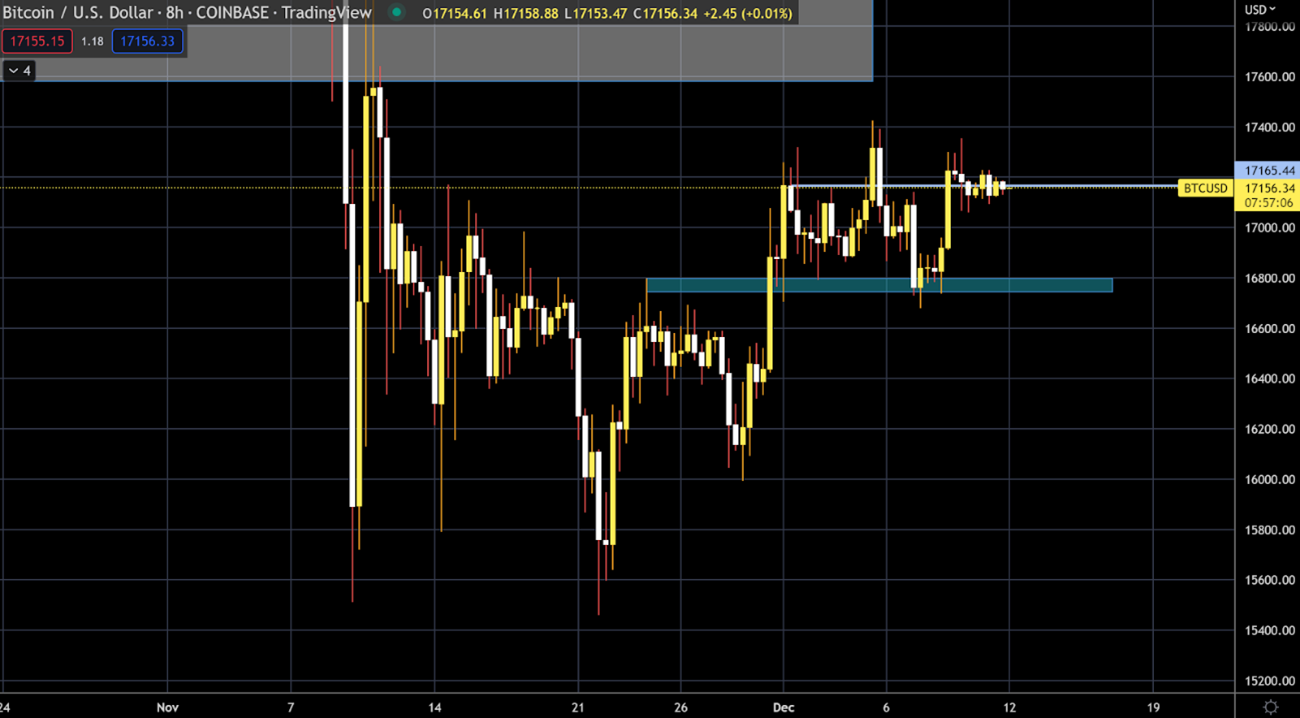
↓ BTCUSD daily candlestick chart

This week (1/9 – 1/15) BTC rose quite significantly, as I mentioned at the beginning of this article. There are three main things to keep in mind of the current situation and our strategy going forward.
(1) BTC’s temporary bottom seems to be around the recent low of $16,000. It appears to have made a double bottom over a period of about two months.

(2) The pattern is as follows: The price is expected to move up to the next level. Rather than continuing to rise, the price is expected to make a temporary adjustment. The following two patterns are assumed, which are often seen in BTC, and are similar to an inverted triple move. The pattern is for the price to push to $18,000 or $19,000. The monthly and annual charts are positive, so we would like to go long at the point where the price pushes.


It will be interesting to see if it also retests the daily 200MA.
(3) It cannot be called a trend reversal quite yet.
This is because, when observed dispassionately from the chart, it has just returned to within the range of the pre-FTX shock levels.
↓ BTCUSDTPerp most recent OI (open interest)

Also, looking at the OI change in the above chart, the most recent increase is due to short covering. The amount of open interest (OI) is decreasing as the price rises. In other words, this is a transitory rise due to short positions being closed out, and without an increase in new open interest, it may be difficult to maintain the rise any longer.
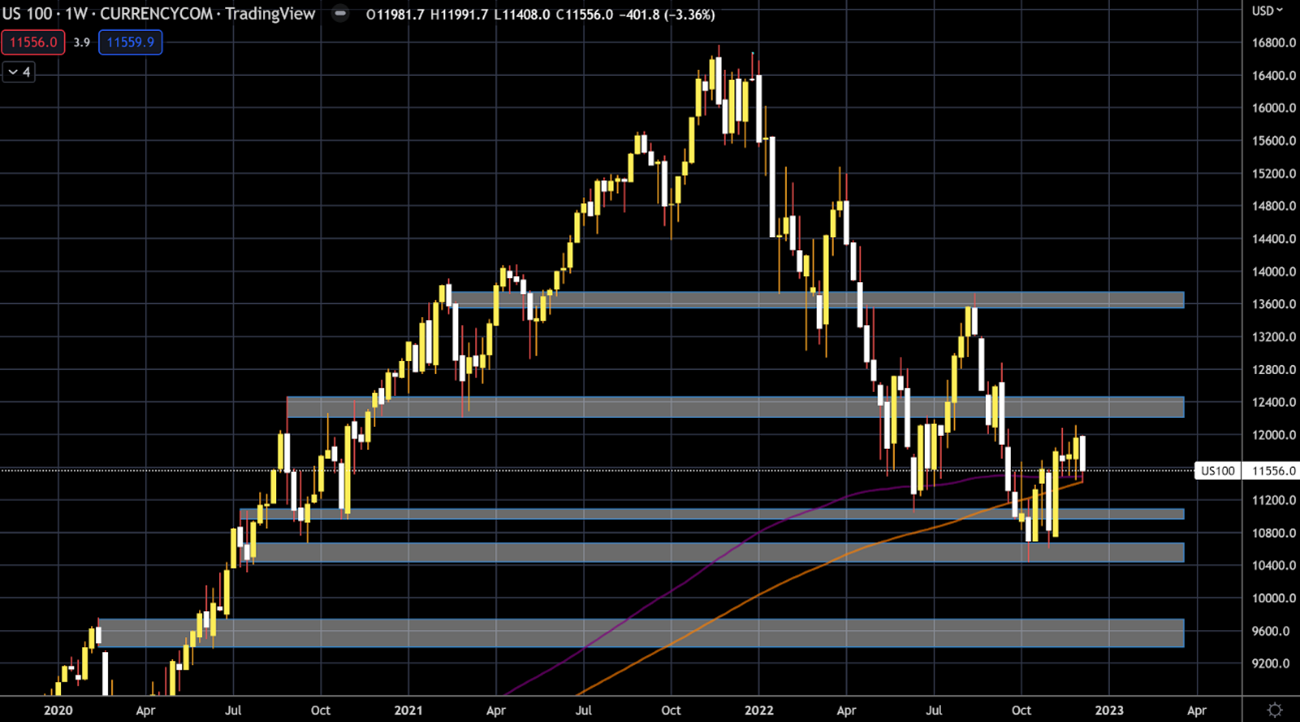
The setup of the US100 was unchanged from last week, so I have omitted it from this report.